I am Still Working on MET Data

Hey I am adding this part way after the fact. This project is on indefinite hiatus, mostly because of how hard it was and partly because of this really cool paper everyone should read right now. They basically do what I was trying to do but better, that is make a single cell model based on gene expression of a particular neuron. They don't succeed to my satisfaction but it is a huge step in the right direction. It also reinforced my opinion we either need better gene expression data or some other data modality to create good models.
Upon some further thought, I have decided to pursue the RNN route for a few reasons:
- the prospect of using NEURON fills me with dread
- ditto for making my own neuron models as if I'm going to do a better job than the standard tool in the field
- having read this paper more closely, it took them "...model generation for the entirety of the single-cell experiments required the evaluation of more than 130 million single-cell models and 3.5 million central processing unit (CPU) core hours." for 230 ephys experiments which is just a non starter for me with my computing power
- I've found a few papers on this I'll be referencing on, simulating biological neurons with traditional ML is not novel, just adding in transcriptome information is as far as I know
Also, just to get this out of the way, I'm a big idiot and wasted a lot of time looking at BAM and fastq files I have no experience with. Everything can be found here but I am just using ephysiology and transcriptome data for now, I may add morphology later. Anyway if you want to copy me, use these links to get counts by gene for a given cell and this for the ephys experiments.
As a brief aside, I think the smart thing to do would be to have template conductances for a bunch of different cell types and tune them based on more fine grained transcriptomic differences. In a perfect world, template neurons for an easily genetically distinguishable subclass of neurons may be all we need for uploading, no fine tuning necessary. I'm not working on this for a few reasons:
- I don't know if 230 neurons is enough of a sample size to effectively train a model that has potentially thousands of inputs (how many genes are you looking at?) and low double digit outputs (conductances, passives) with relatively small differences
- I don't think we live in that perfect world where we can just use template neurons with no fine tuning
- All these were taken from the visual cortex so the number of cell types is probably limited depending on how specific you want to get with that definition, still pretty new to neuroscience I geuss, bottom line is I don't think this will generalize even if it worked because of limited data
- The biggest of them all, I'm really lazy and I can't immediately find which 230 neurons they did this work on so I'm just going to do my own (much more fun and stuck in my brain) idea
So, what's the actual plan? First is predicting some derived electrophysiology features from the gene expression profile. If that works then I'll move on to a full recurrent model. The way I see it, even if I can only predict derived parameters that massively limits the search space so it's a big win, at least for me. Plus the meta goal of all my projects is to enjoy myself. It's like my dad always said "The first rule of computational neuroscience is to have fun and be yourself :)".
Hopefully I will be able to get derived electrophysiology parameters from this or something like it, I just found it as I am multitasking but yeah hopefully it will let me not write a bunch of boring code.
Hey, that library is great! Only downside is I think it can't characterize the current input which is kind of half the battle you know? Bad new bears, the metadata in the NWB files also doesn't have the stimulus type as far as I can tell so I'm going to have to write that up, I mean chatGPT is probably going to but I'll debug it.
Man I should make this a listicle the way I'm about to give another list, this time is a very practical to do list that will also be your guide for what to expect:
- Classify ephys current stim into different type and extract things like peak current and all that stuff
- Select which derived ephys features I want to extract using eFEL
- Make my own dataset of a subset of genes, current injection properties, and derived ephys features
- Train some kind of machine learning model to predict those e-features
- Celebrate in some small way if it works, if it doesn't, add morphology, if that doesn't just beat my head into the problem for 3 months
- Try the LSTM or something with more complete data
Pretty cool plan ehh?
I had what I thought was a good idea, take the stim current and apply a Fourier or wavelet transform and just sidestep all the work of describing the current series but the more I look at it the more it looks like that will just drown the network in mostly useless data so I'm going to try something else. I will somehow detect ramp and chirp stimulus then the rest are roughly square waves or noise. I don't know what I'll do with noise because noise is, kind of by definition, not compressible. Maybe I'll just ignore it. Anyway, for the square wave pulses I can pass number of pulses, time of the first/last rising edge and amplitude and that should be enough. Maybe not, who's to say.
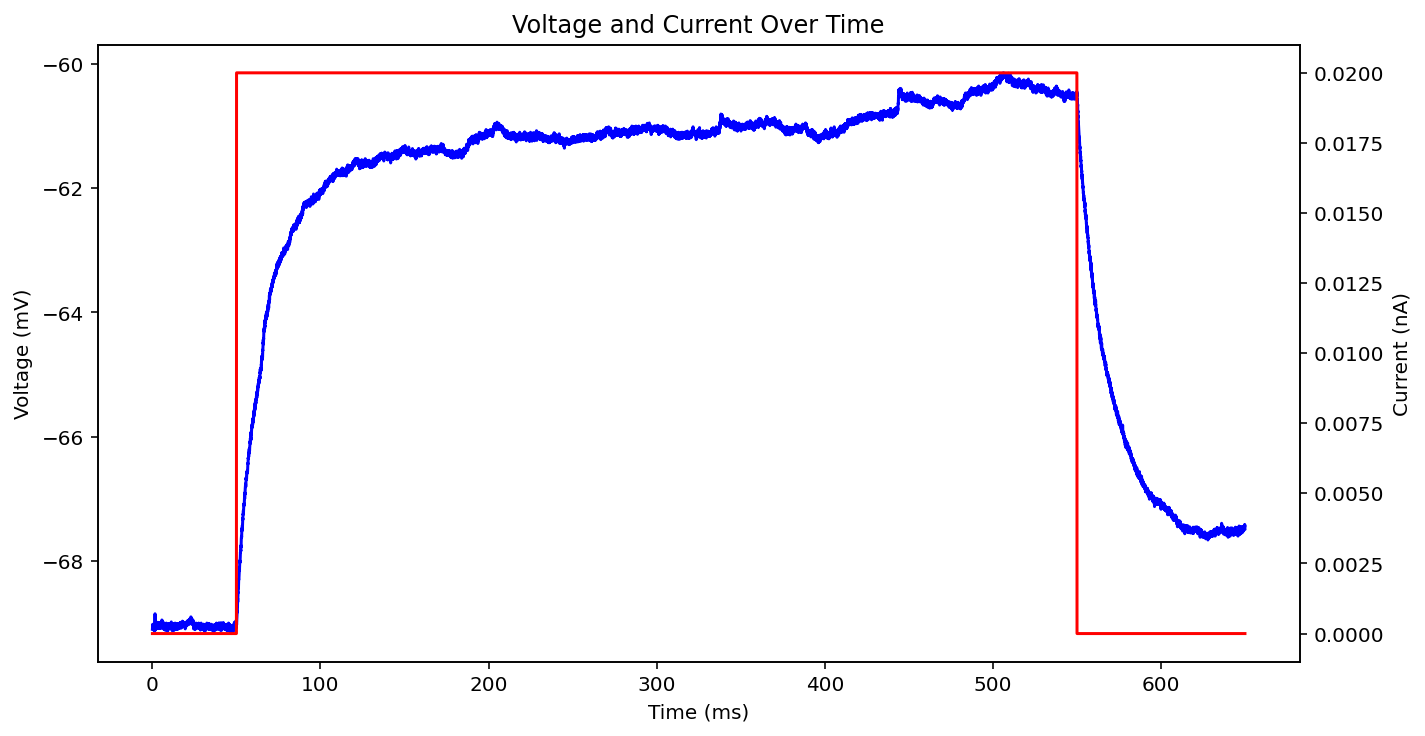
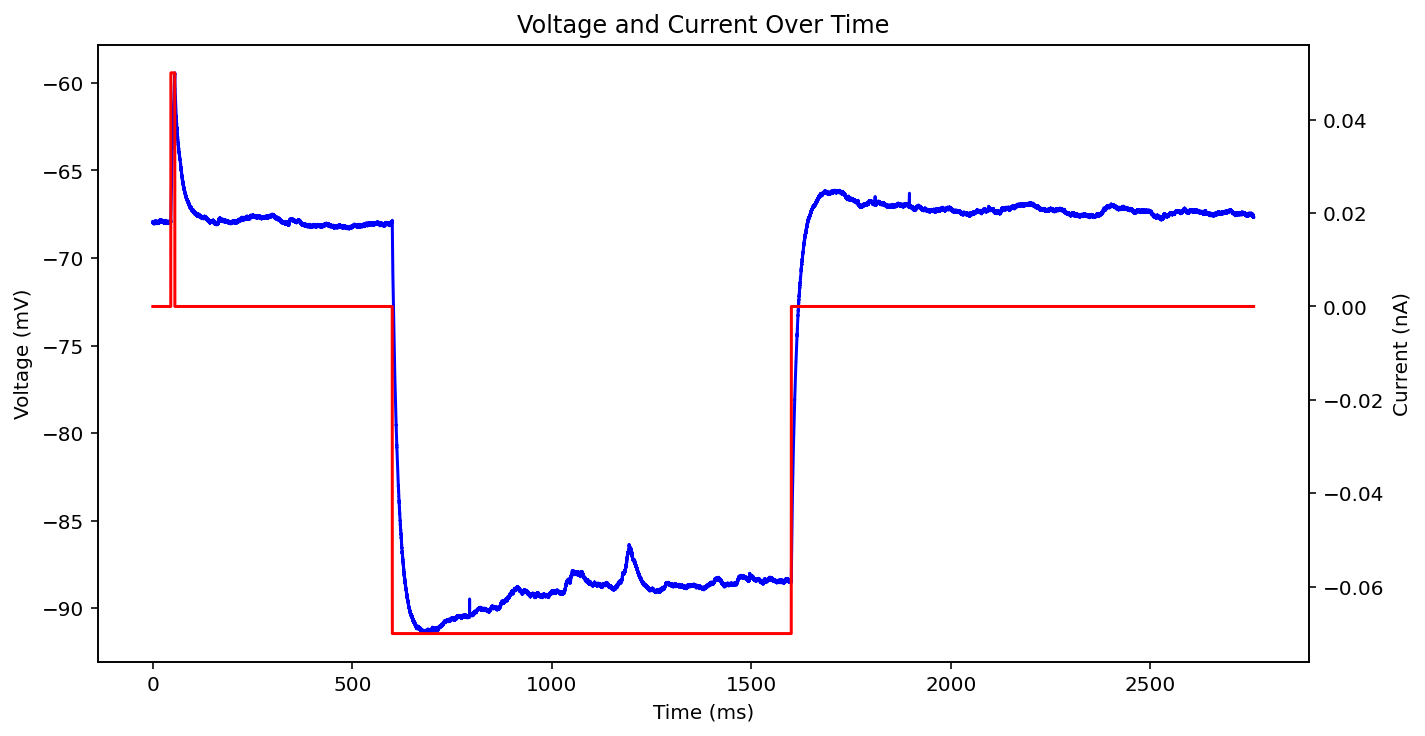
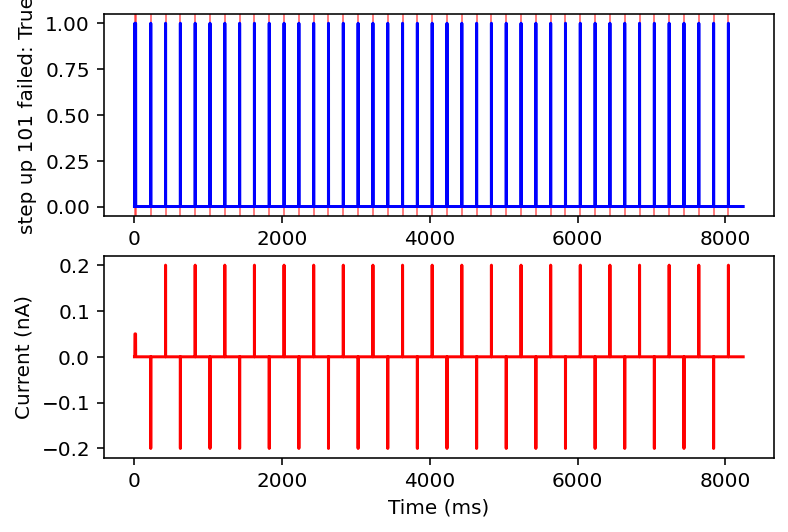
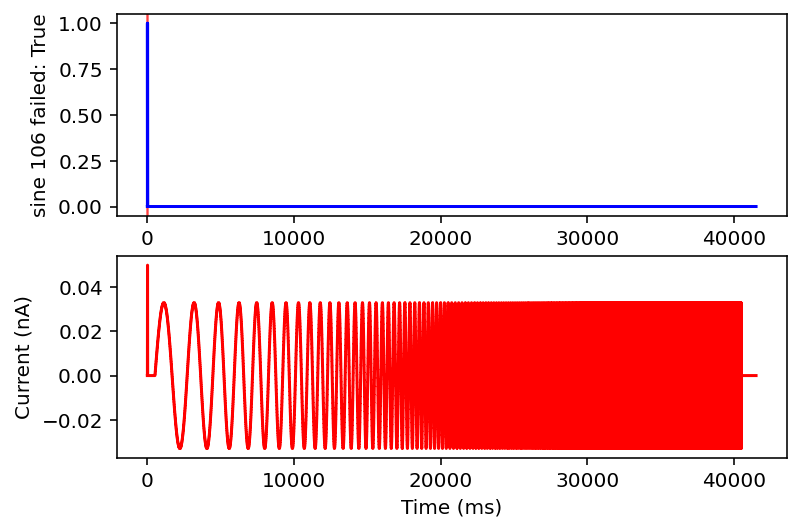
There are actually even more examples than this, there's some weird low frequency sine wave, just no input at all, some step input, and some more of the same missing that initial little priming square pulse of 0.05 nA you see a lot. See what I'm dealing with? why couldn't the metadata just say what type it is huh? It probably does and I'm just too stupid to figure out how to read it.
Ok after mulling it over I think I am going to only look at ramps and single square wave pulses. I am going to check if there are exactly two rising and falling edges (priming pulse and stimulus pulse as I will call them) or if there's just the priming pulse and a ramp. Anything with noise or funky sine waves or step ups is getting thrown out. This might ignore some interesting resonant properties of the neuron but this is very much the first pass, I'm drowning when I need a drink. I'll give it the max and minimum current values after the priming pulse, the total area under the curve (proxy for pulse width or something), and total time of the recording. I think this will be sufficient information in a lot of cases.
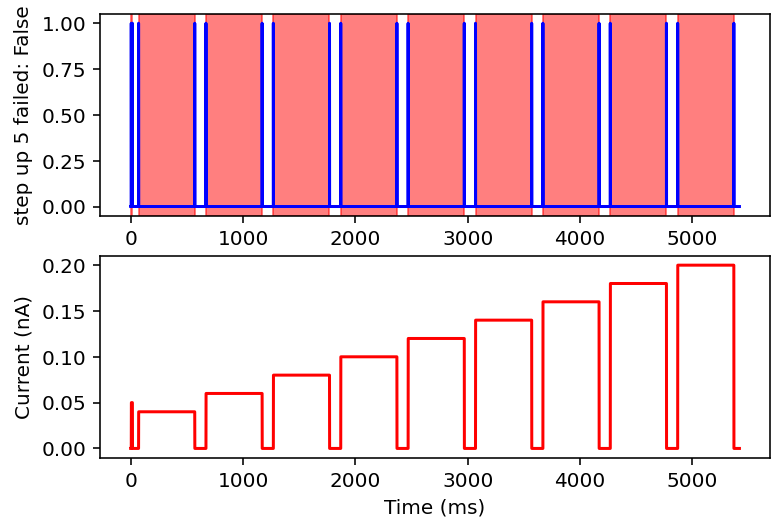
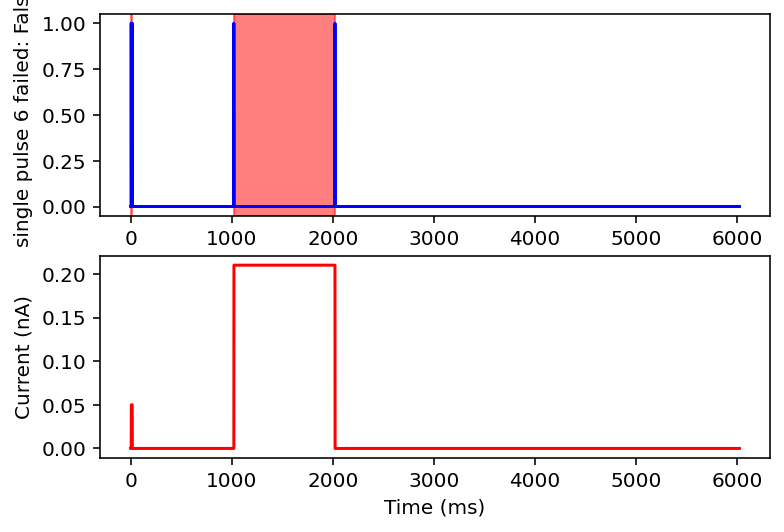
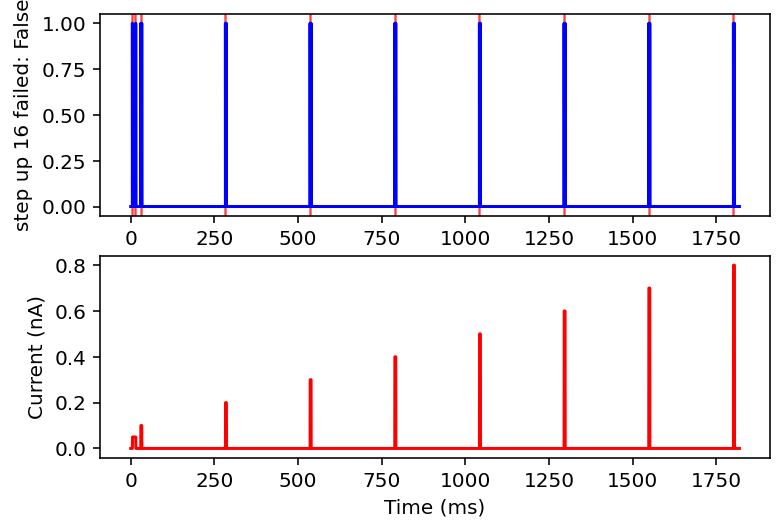
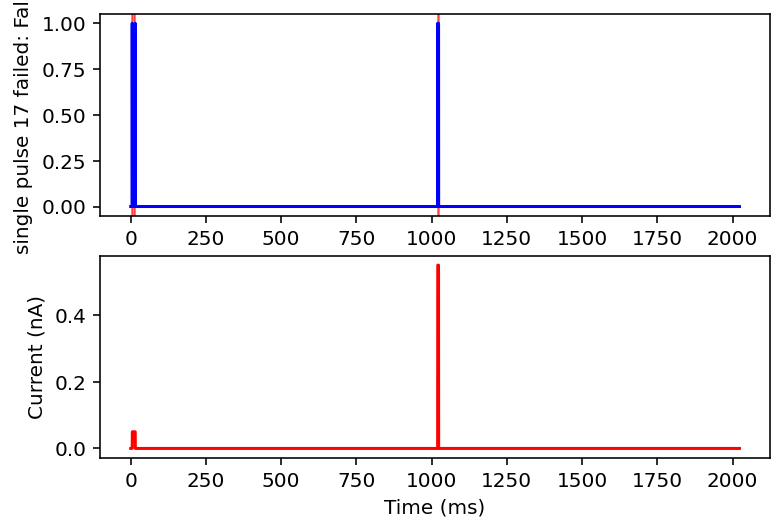
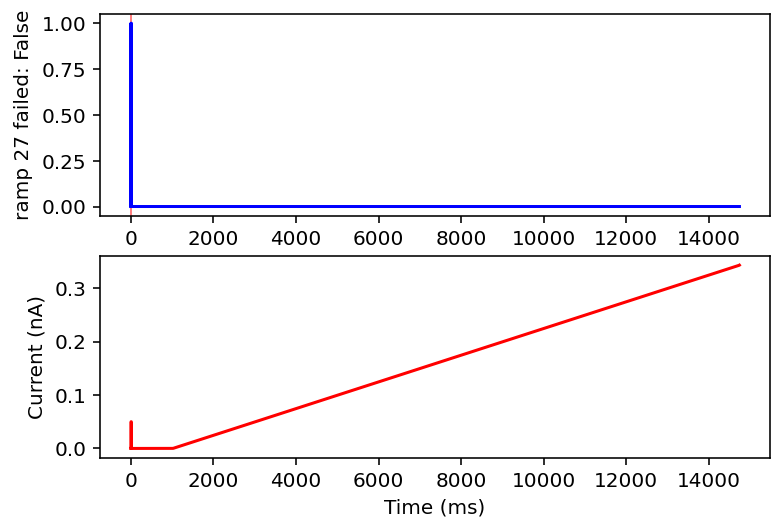
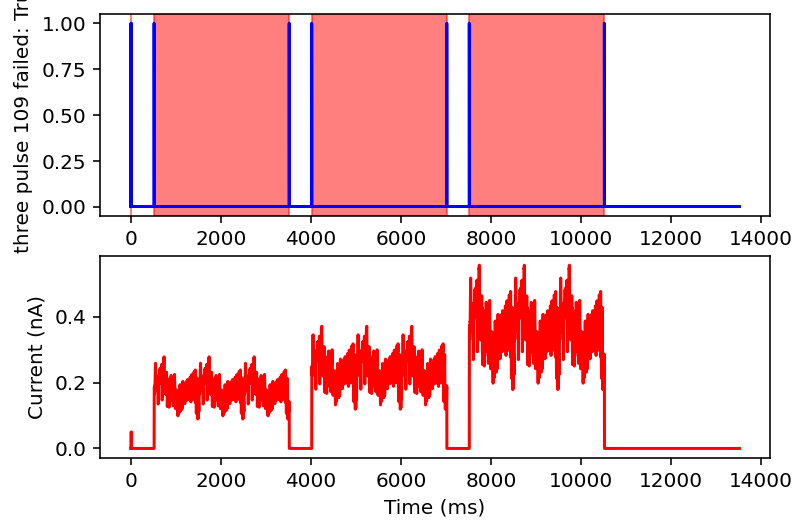
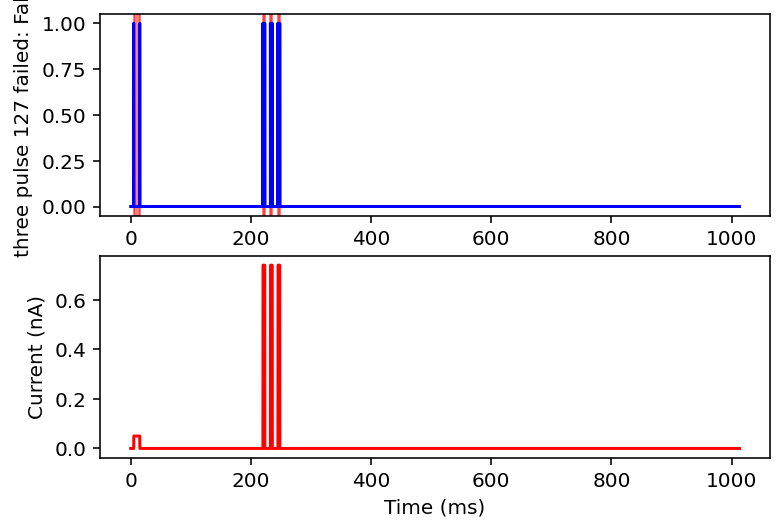
failed: True means data will be excluded, some currents that are filtered out will have the wrong name
I don't have the energy right now to explain all this but basically it filters out noisy inputs, sine waves, and those weird narrow oscillatory square waves and leaves everything else. Now it will also filter some other things out on accident but I really don't care, this is good enough for me. Plan for tomorrow is to combine this code with the transcriptome data to get a (finally) unified dataset of gene expression and electrophysiology. Code is here.
This code is sloooowwww but I have ~300 of the experiments saved. The code is here. It has a terrible memory management problem where it will just kind of fill up then crash. I'll fix that at some point maybe. Bottom line is that I'm going to start testing, or at least make all the architecture to test. I don't know how I should deal with normalization and whatnot. There is a certain beauty in just not doing that (I'm lazy and impatient).
̶H̶e̶y̶ ̶s̶o̶ ̶t̶h̶e̶ ̶f̶i̶r̶s̶t̶ ̶t̶e̶s̶t̶ ̶w̶a̶s̶ ̶a̶n̶ ̶e̶n̶o̶r̶m̶o̶u̶s̶ ̶s̶u̶c̶c̶e̶s̶s̶,̶ ̶l̶i̶k̶e̶ ̶a̶b̶s̶o̶l̶u̶t̶e̶l̶y̶ ̶p̶h̶e̶n̶o̶m̶e̶n̶a̶l̶ ̶I̶'̶d̶ ̶s̶a̶y̶.̶ ̶I̶ ̶s̶t̶i̶l̶l̶ ̶n̶e̶e̶d̶ ̶t̶o̶ ̶g̶o̶ ̶i̶n̶ ̶a̶n̶d̶ ̶v̶e̶r̶i̶f̶y̶ ̶a̶ ̶l̶o̶t̶ ̶o̶f̶ ̶s̶t̶u̶f̶f̶ ̶b̶e̶c̶a̶u̶s̶e̶ ̶I̶ ̶l̶e̶t̶ ̶c̶h̶a̶t̶G̶P̶T̶ ̶d̶o̶ ̶a̶ ̶l̶o̶t̶ ̶o̶f̶ ̶t̶h̶e̶ ̶p̶y̶t̶o̶r̶c̶h̶ ̶d̶a̶t̶a̶l̶o̶a̶d̶i̶n̶g̶ ̶s̶t̶u̶f̶f̶ ̶s̶o̶ ̶w̶h̶o̶ ̶k̶n̶o̶w̶s̶,̶ ̶m̶a̶y̶b̶e̶ ̶a̶l̶l̶ ̶t̶h̶e̶ ̶n̶o̶r̶m̶a̶l̶i̶z̶a̶t̶i̶o̶n̶ ̶a̶n̶d̶ ̶t̶r̶a̶i̶n̶/̶t̶e̶s̶t̶ ̶s̶p̶l̶i̶t̶t̶i̶n̶g̶ ̶i̶s̶ ̶m̶e̶s̶s̶e̶d̶ ̶u̶p̶.̶ ̶B̶u̶t̶ ̶a̶s̶s̶u̶m̶i̶n̶g̶ ̶i̶t̶ ̶i̶s̶ ̶n̶o̶t̶,̶ ̶t̶h̶i̶s̶ ̶t̶h̶i̶n̶g̶s̶ ̶a̶b̶s̶o̶l̶u̶t̶e̶l̶y̶ ̶s̶l̶a̶p̶s̶.̶ Loss went from ~50 to ~0.5 once trained. I need to do some work to convert all that back to non normalized values, this that an the other but right now I am going to let myself live with the belief that this is working great and do all that stuff tomorrow. Code is here.
Future Dom here coming back to interject, it did not work great. I mean results were somewhat encouraging but it's basically trained to just predict the mean value hence low loss but crappy results.
Ok I did that whole thing with training and then I tested it this morning the results were subpar I'd say. I think I was too ambitious in this first test. The output data was too diverse with so many values being set to 0 artificially because that feature wasn't present in the data. It was just messy and complicated. That said, there were some things with roughly positive correlations. As such, I am going to restrict the next model to just single square wave pulses and have it look at these efeatures:
- voltage_base,
- time_to_first_spike,
- time_to_last_spike,
- sag_amplitude,
- sag_ratio1,
- sag_time_constant
- minimum_voltage
- maximum_voltage
- spike_count
Now, sag ratio stuff will be 0 whenever the input voltage is positive but I'm hoping that is a simple enough condition the network can learn it. Similarly, the time to first and last spike will be 0 if there are no spike. Maybe if this doesn't work I will further spit the data into just positive and negative stimulus pulses. There's nothing theoretically wrong with that, it's just annoying is all.
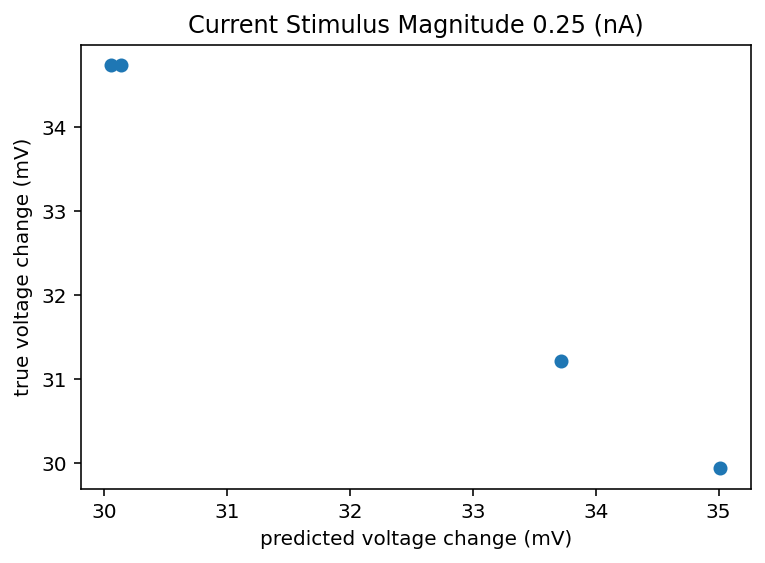
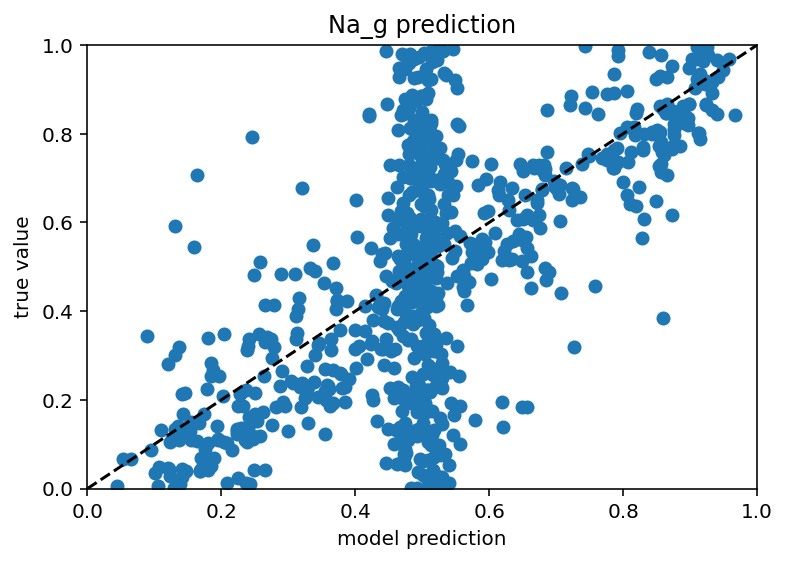
Code is here. I'd say it still isn't done but this is moving in the right direction. I think the next step would be to just train on positive pulses because I think the sag ratio/number of spikes things might be confusing to it. I'm not sure and I would like a unified model, but I'm still so new to this that taking the absolute simplest step might be the right move. For the time being, I will show some graphs that make me think this might have some promise.
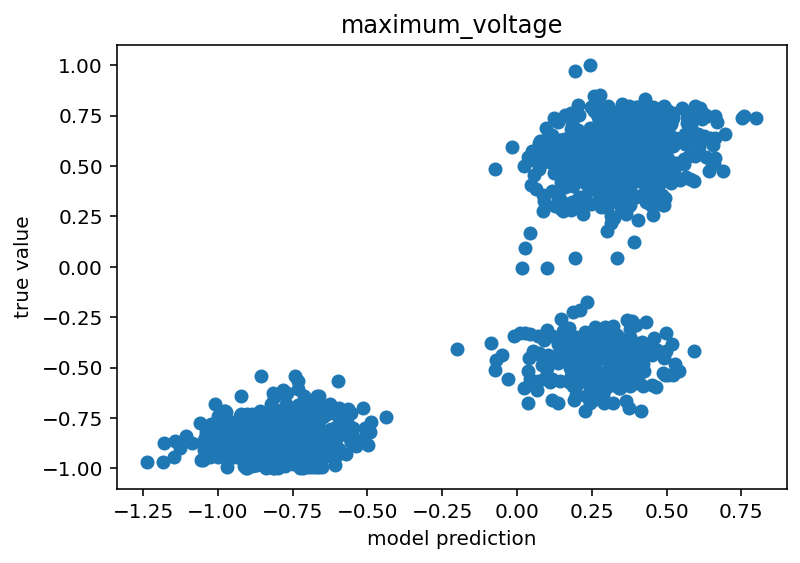
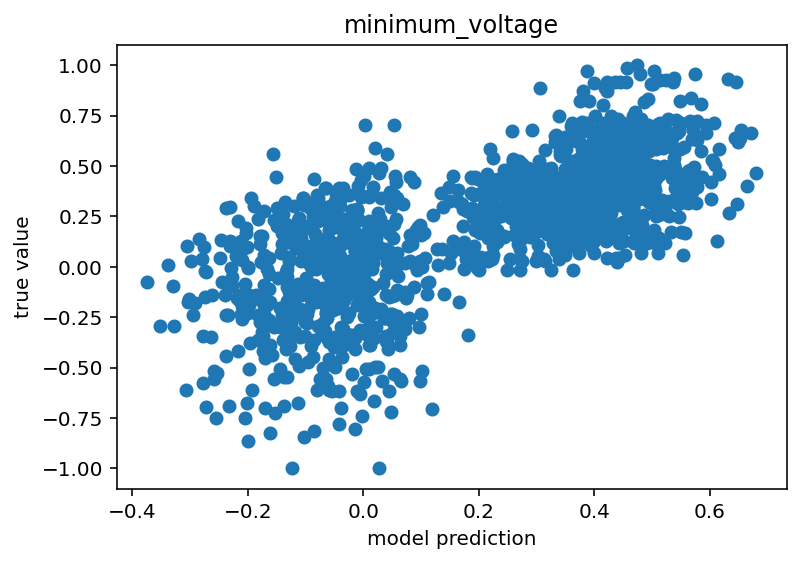
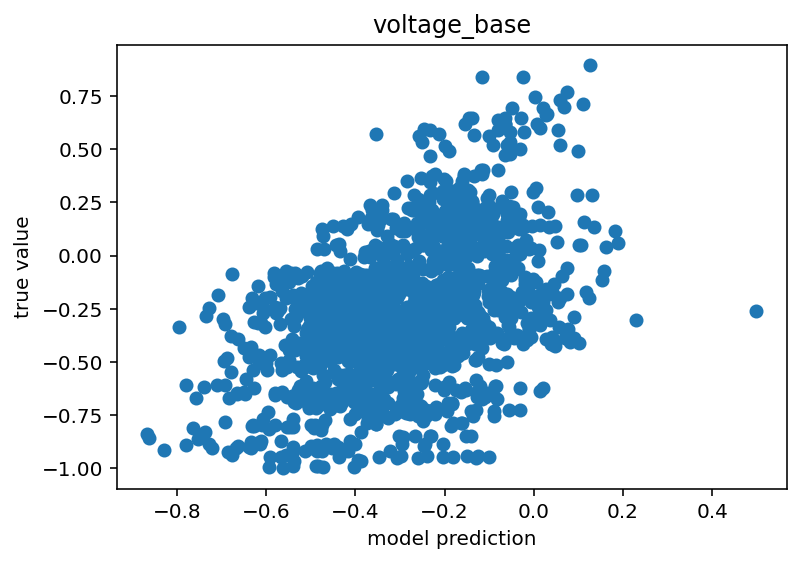
The voltage base clearly has a (weak) positive correlation. As for maximum voltage, there are 3 clusters. I believe these are the states where the network has negative stimulus, positive stimulus with no spikes and positive stimulus with spikes. The positive stimulus situations are primarily separated by the difference in the true value but I believe there is a slight different in their predicted centroids as well. Similar reasoning for the minimum voltage although the separation is much less clear.
Hey so that has once again given crappy results. As such I am deciding to try another thing. I looked up this list of ion channel genes and instead of looking at all genes (or like a subset by how common they are) I'm going to just look at these hopefully. I also might try and do something like take the logarithm of the counts because there seems to be a pretty huge spread but that's a lot more speculative. Having gone through that site and the csv with all the genes in it, there are only 11 which overlap which actually seems quite low but I am just a humble man so I can't complain. Man, if only I worked in a lab with a lot of genetics people that could help me on this. I take it back, they are almost all there I think. I was just foolishly filtering them out because a lot of them lack high counts. Perhaps this is why my model is so bad.
Having now done that whole looking at only genes for ion channels thing, I am sad to announce that it gave seemingly worse results than before. Because of that, I am going to spitball some ideas to make this better:
- look at all genes and track their correlation coefficient with several e-features and select based on that, blind to how commonly they are expressed and what their actual function is
- integrate morphology data
- make all voltage relative to the starting voltage (earlier stuff seemed to indicate their was a wide range of resting potentials for cells with multiple patch clamp sessions indicating that it might not be a very reliable reading/it is influenced by outside factors)
- make a model that predicts one efeature in one stimulus condition (what is the number of spikes for a current stimulus of single pulse at 0.05nA?), this would mean that the current input is implicit and the model can focus on learning relations with gene expression/morphology alone
- I might just be bad at machine learning and I need to figure out how to build a model better.
- only use the ephys session from when the transcriptome was taken, ignore all others even though they are the same cell (added retroactively, read on, even more retroactively, I realized I had mixed ephys from different cells)
As an aside, I did a cool normalization trick where I looked at gene expression relative to other genes in the same cell as opposed to normalizing based on maximum count for that gene across all cells, it didn't help but I think this makes more sense as we care about relative gene expression right?
The official Allen Institute package is for python 3.9 and definitely did not cause me any frustrations. Whislt I'm here, I should say that I'm copying the morphology data from this paper which is kind of what inspired me to do this. I'll probably also take the efeatures the way he does, or at least split up maximum voltage with and without action potential.
Ok I'm facing another set of problems that are really just debuggy not interesting but I think there's a decent chance the ephys is not lining up with the right morphology and trans data which would explain crappy performance. I need to fix this. Great, ok I totally fixed and validated that, here is the code. Bad news bears, this throws crazy errors most of the time and I have no idea why, the morphology parser just doesn't work pretty often. What's worse is I can't recreate the problem when I isolate the function that parses the morphology. This is why I hate using other people's code. It's not fun to debug this.
I'm so dumb, absolutely not their fault. The problem? There is not full morphological reconstruction for all ~4000 cells, only for ~500 which would really limit the training data. I mean, I'll do it for all of those but man, that sucks. I guess tomorrow is going to be analyzing those 500 and then using very similar code to look at just correlations between gene expression and ephys, ignoring morphology as I was before.
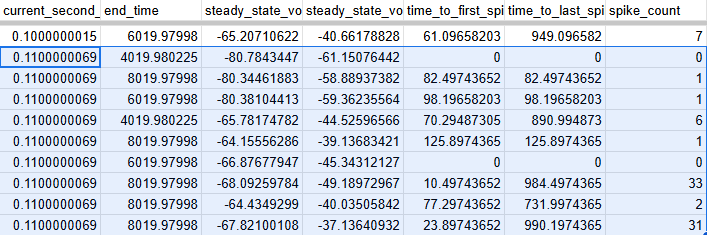
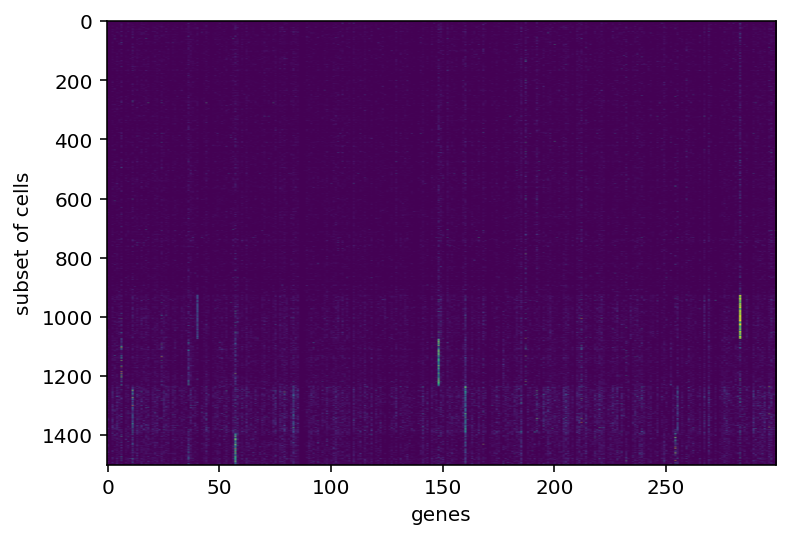
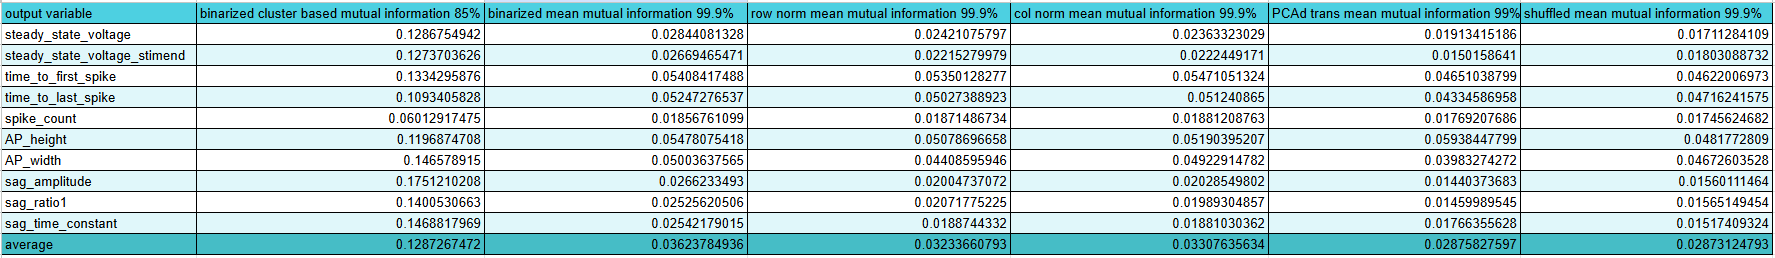
I'm working on what I was just describing. I plan on using pearson r, mutual info regression, and variance threshold to try and extract which features are important. I don't know too much about those last two but they seem to be standard tools and are in sklearn so should be easy to implement. What I have noticed is that there is an enormous spread on all this data. Like absolutely massive. The below image shows what I'm talking about. There's different resting potential (stead state voltage) and different deviations from that when the current stimulus is present (steady state voltage during stim). Also, spike counts are hugely varying. Yeah, it's mostly 1 and 0 but there are two that just went to 30+, what's that about? Anyway, the silver lining is that my model can apparently be a lot sloppier before I call it a success. Maybe I can inject some random noise before or after? Or generate some probability distribution? Both of those sound super complicated actually. Anyway, here's a link to that data if you want a closer look.
Just had a brilliant idea, I can pair off the data for a given cell and given current stimulus and see the correlation coefficeint and what not of just that data and that is the realisitic upper bound of my accuracy predicting from morphology and transcriptome data. Yeah that's smart I'll do that.
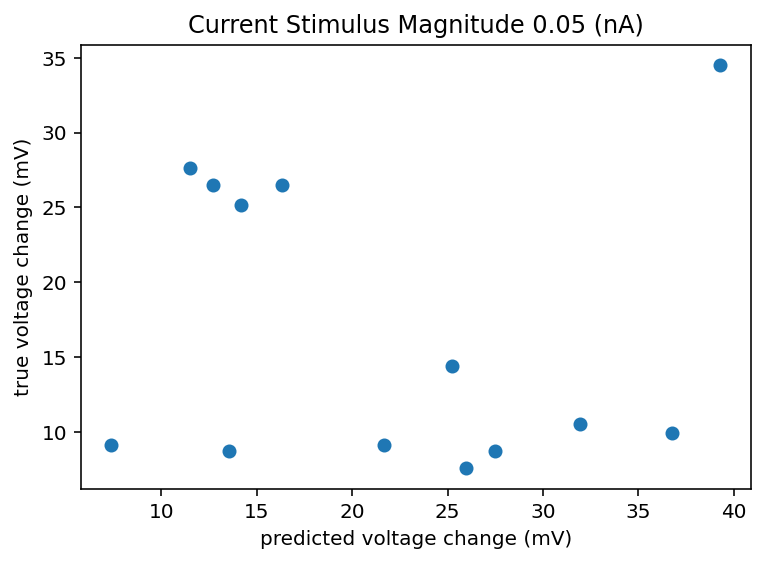
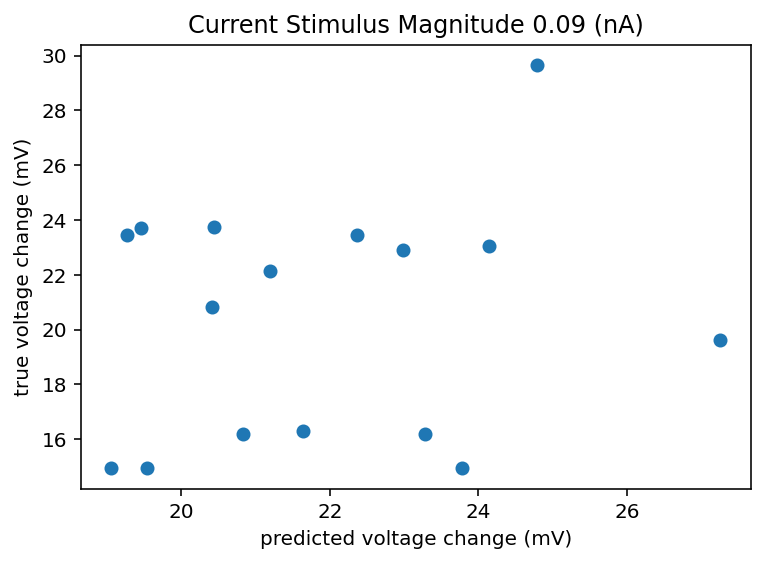
I did that and honestly the results are kind of demoralizing and call into doubt this whole project. This is only data from 5 cells but I imagine things don't radically change if I looked at 500 cells. If there can be a 10 or 20 mV swing in the change in voltage from resting to the new baseline during stimulus, how am I meant to predict that and what does it even mean to have an accurate neuron model in that case? It seems like noise dominates on any time scale longer than minutes. If I get crappy results I think I am going to ignore all the ephys recording sessions that aren't the same one as when the transcriptome was taken. I don't know how much that is responsible for the spread but it will at least homogenize the data or hopefully filter out whatever nefarious outside influence is giving such an enormous spread. In fact, I am going back up to retroactively add this to the list of things to try. I should explain how I did that predicted change thing. We have n samples for a given cell, I took 80% of n and looked at the mean and standard deviation of those. Now if we want to predict another sample we can't do better than just expecting to draw from that same distribution that generated the ones we observed all ready right? So I generate a random number from a normal distribution with that measured mean and standard deviation. So that's what is on the x axis, I don't see how a machine learning model could do better than that, I mean maybe just always predict the mean but hey that's boring. Bottom line is the spread is huge and here is the code. Oh I should also check to see if the variance between cells is larger than the variance within cells, if it isn't the whole project is kind of dead. Bolded so that I am reminded to come back to this.
Oh my gosh I'm sooooo dumb. Remember before when I said 'oh wow the variance for a given cell is huge, this is outrageous' well that's not entirely true. I think I've been grossly misinterpreting how this data is stored. It's probably 90% my fault but hey, it wouldn't have hurt them to do a better job naming things imo. Doesn't matter bottom line is I can strip out the ephys data and it should make everything make more sense because I'm not inadvertently adding different cells' ephys together.
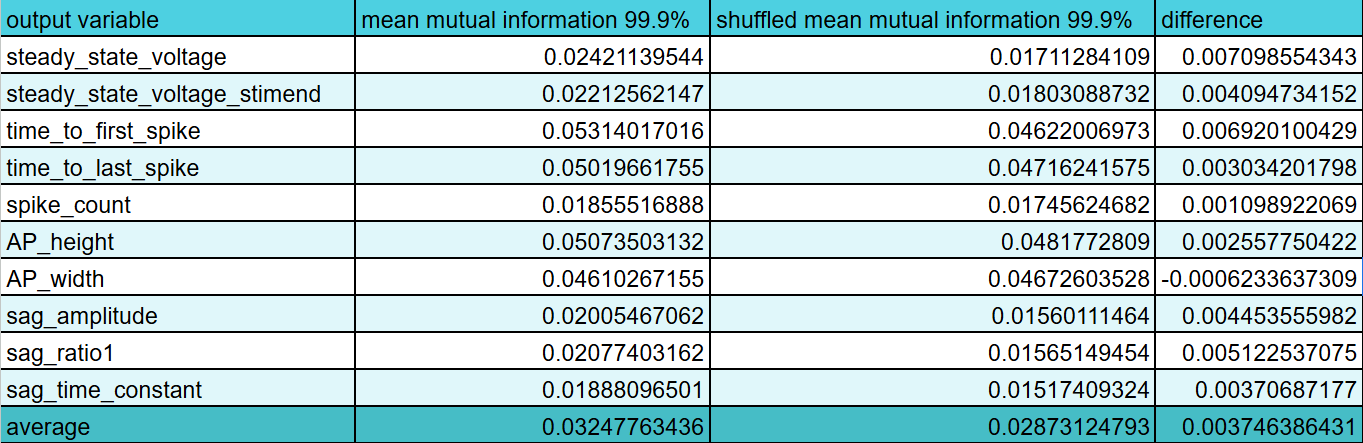
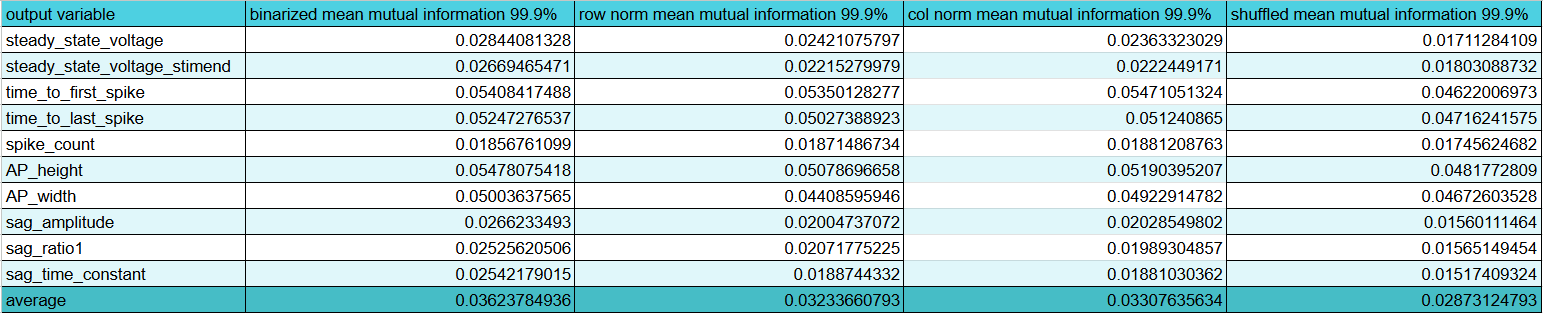
Ok I fixed that little hiccup and now we're back on track. In fact, we are now to determining feature importance and let me tell you I love whoever made the mutual information regression package for scikit learn. It works great and very intuitively with multiple inputs for one output feature unlike trying to just take pearson r with scipy. I'm probably just being dumb though. Anyway, code here. Great so working on that more I have made a program that will save mutual information for each input feature (morphology or gene expression) for each output feature (all the ephys) for each current stimulus level of a square wave pulse. Later I will write another program to average all that out and select the best features. Here is the code.
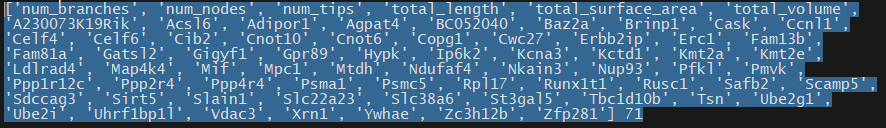
Great! That's done and I have my list of features. Post processing code here. It looks at the upper percentile of the mutual information for each ephys feature and then sums up how many times a given feature was put in an upper percentile. Then I take everything with more than 1 vote and it's an "important feature". I'm sure there's a more advanced way to do this and this might miss some features that are very important but only for one output feature, but this is a good starting point. Interestingly, the morphology is way more predictive than I would have though compared to gene expression and especially compared to ion channel gene expression. I think only 1 ion channel gene, Kcna3, made it past those filters which might explain why the ion channel only model did so awful. Here's the full list in inconvenient image format.
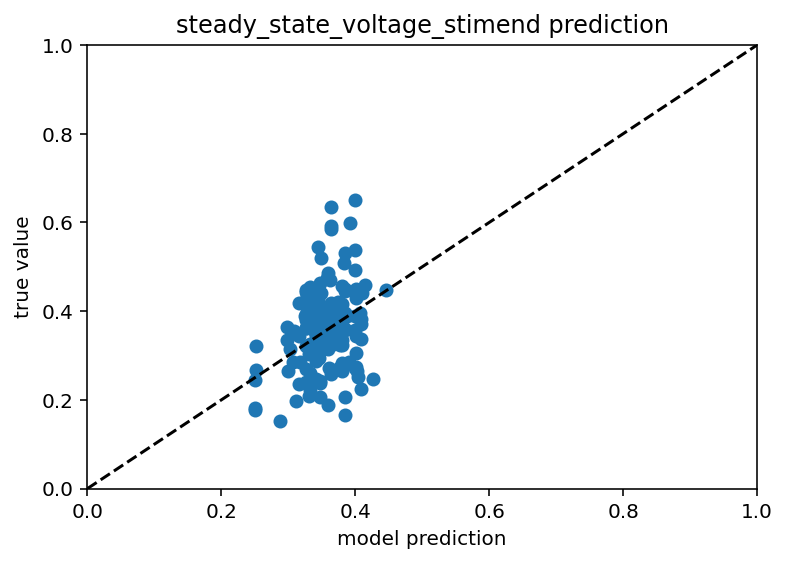
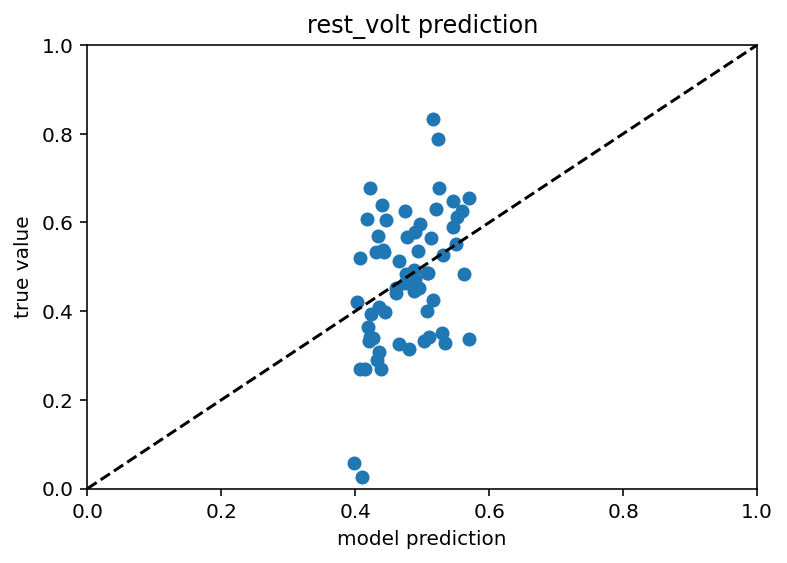
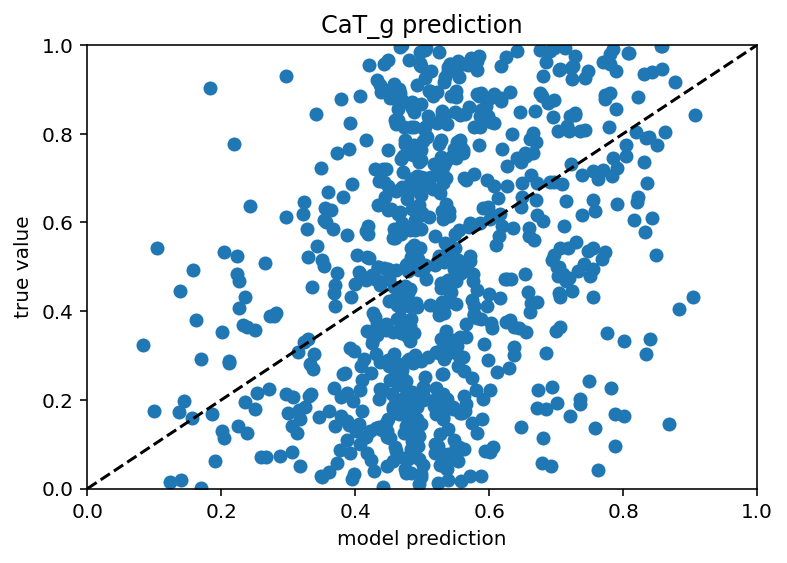
First results are in and they're quite frankly a little sad. I mean my gut says they're better than before but they aren't that nice linear scatter plot I want.
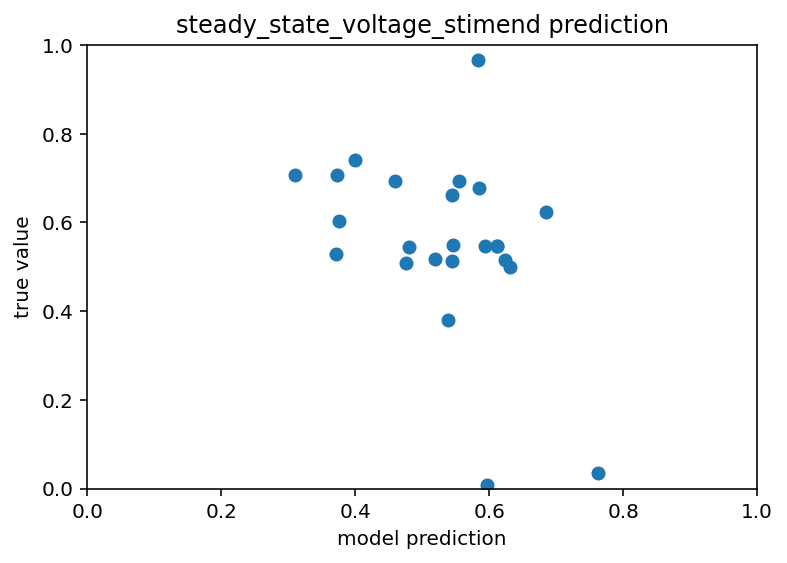
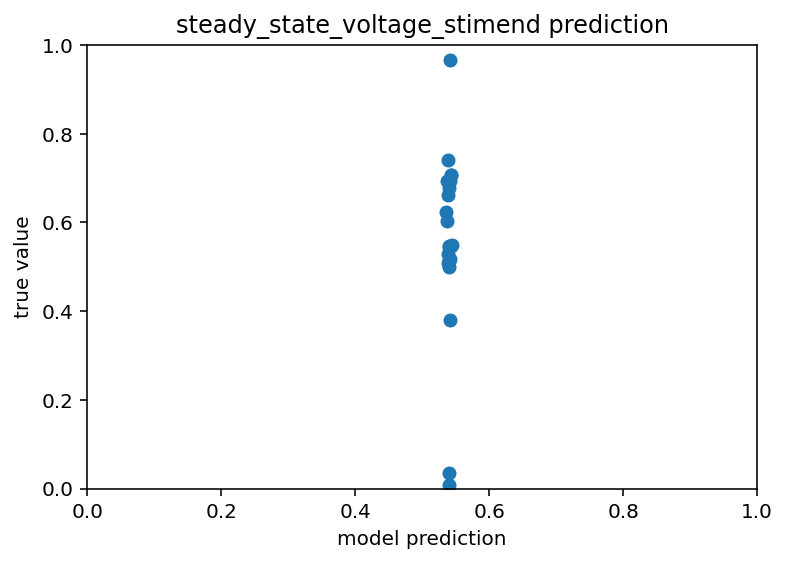
I think part of this is just that the training data is so limited, we're down to ~400 samples after all is said and done, that might just not be enough to make good predictions off of. I'm going to goof off with different architectures and loss functions and what not but if that doesn't work I'm going to have to make some new plans. Current code is here. Eagle eyed readers (not me) may notice that I accidentally had dropout on this whole time during testing. Furthermore, my scatter plots are back to looking like this:
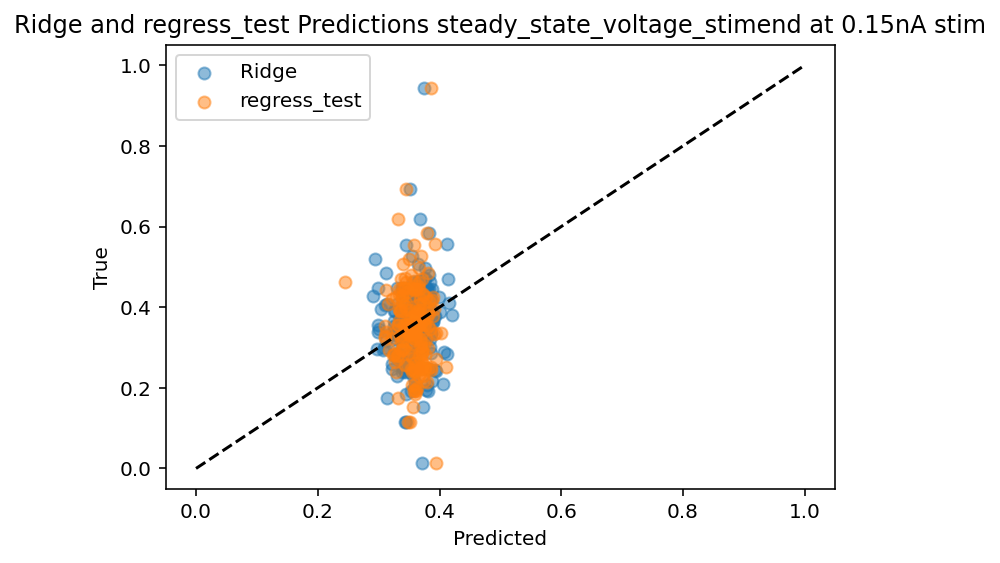
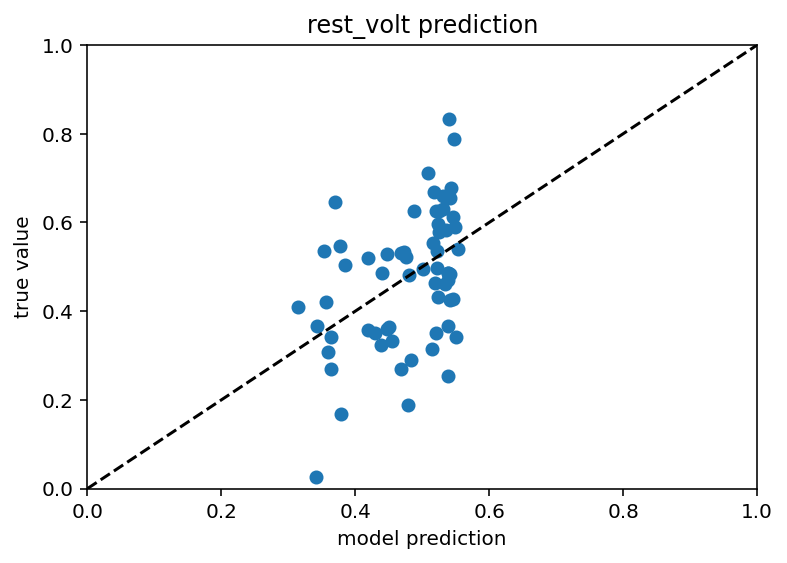
Like all good (and bad) coders do, I have been communing with ChatGPT about this problem. For starters, I was way overfitting. Even drastically limiting the epochs and model size and what not, I still never got good results. But now, I am trying Ridge regression at Chat's behest. It's not bad but room for improvement for sure, R^2 of ~0.4. Code.
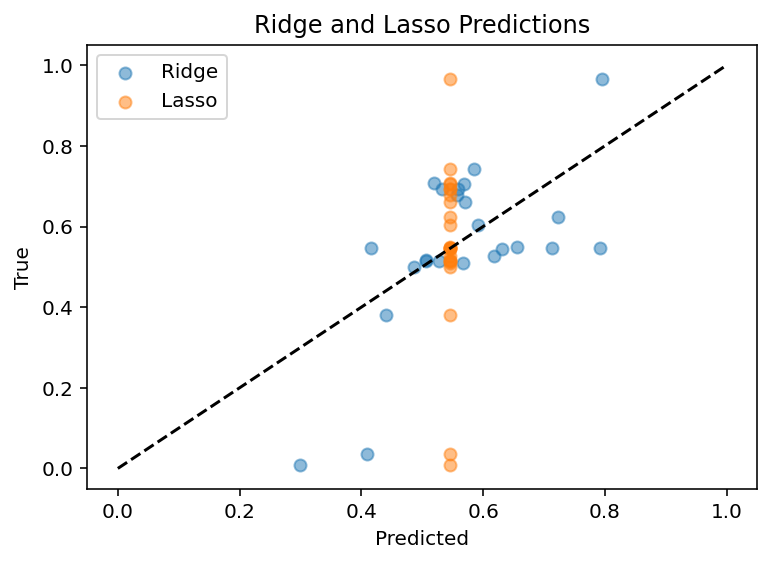
After somewhat exhaustive testing of the regression models on this page, I am yet to find one that really works better than that Ridge regression. As a side note, changing the data normalization from within cell to between cells for gene expression makes it worse which really validates my belief that relative gene expression matters and I am a little proud of myself for actually being proactive and predicting that. Current plan is to do PCA on the data or some of method of finding feature importance and see what I can see. Maybe it will give me a different list of features, maybe I can use a more advanced technique to further filter down to fewer important features. Whatever the case, I can sense we're nearing the end of this project. If morphology is consistently tied to being the most important feature and I only have ~400 cells with full morphology, I just don't know how much better I can do without more data.
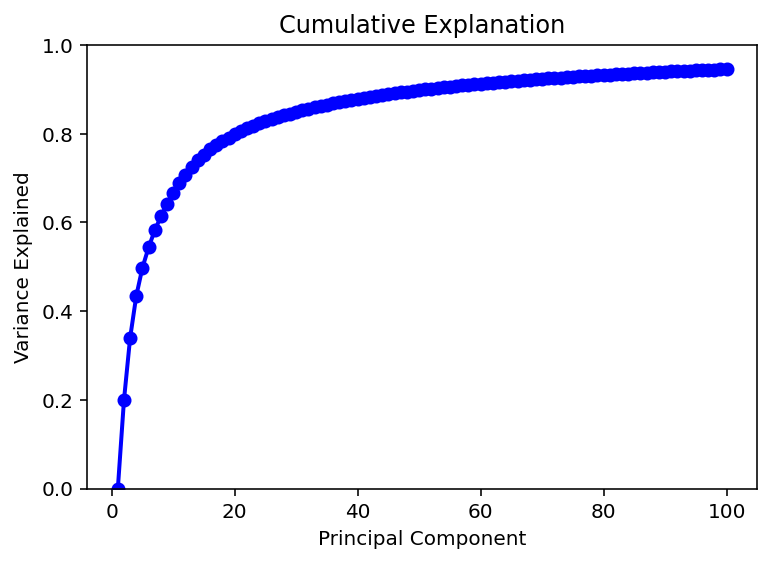
I have followed this page to do PCA on my input data. I have found that 50 components very neatly explains 90% of the variation in the data. An additional 50 components only gets to 95% so I believe I will be sticking with 50 inputs for the time being.
Now comes the (hopefully simple) matter of converting my data into those 50 input components and then retraining the model. Hey it was super easy, thanks chat!
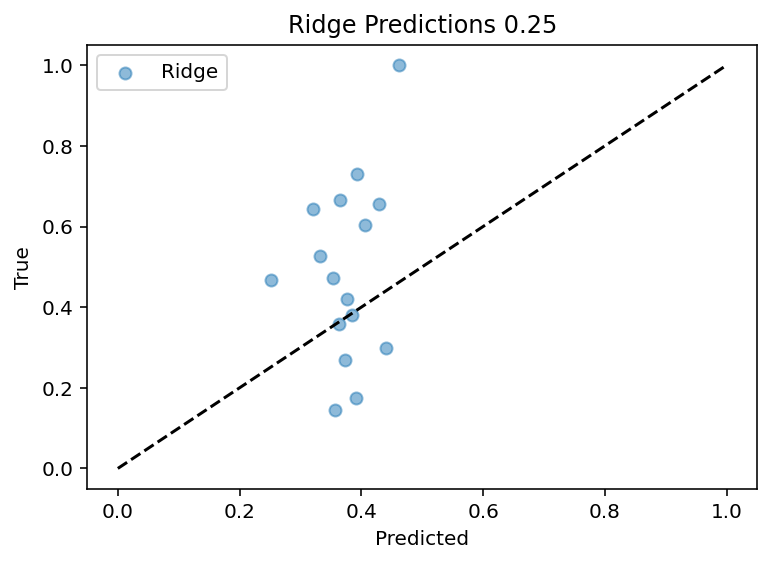
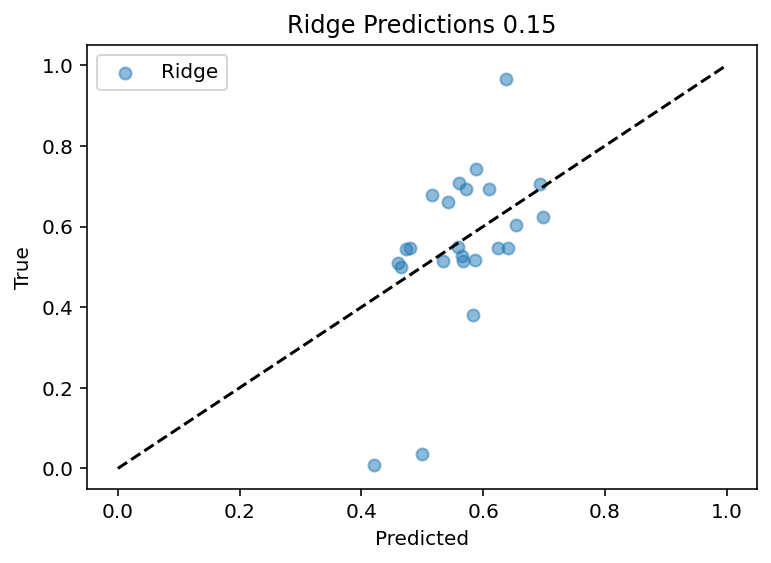
Up to this point, I've been using the input current of 0.15nA as a test case which is lucky as it seems to be one that is better predicted. Now the code works for all currents sequentially although the output features are still manually set. Bottom line is that PCA did not magically solve the problem, in fact it may have made it worse as the R^2 for the 0.15 current input is ~0.25 where before is ~0.4.
I tried with pytorch and it didn't work with that either, this is truly quite demoralizing. Yeah I honestly don't know what to do with this at this point. I mean I could email someone that worked on the data collecting and see if they thing this is even doable. If it's not I'm curious what information would even be needed to recreate the ephys. It's just so weird you know. Maybe I'll reread this paper again and see if I can scrounge together any clues.
I still need to read that paper and also probably this one, but at after some more regressor (nearest neighbor, Adaboost, etc., etc.) testing this morning, I think I am left with 2 possibilities
- This just is not an achievable project, at least without more data
- I am doing something really comically dumb
As such, I am going to put this on hiatus for a while unless something huge jumps out at me from those papers.
Updates after a whole one day and without rereading those papers. First of all, there are more morphology files, some of them aren't full reconstructions from what I can tell but it is worth a shot for more data. Second, I am almost done getting all the ephys data processed so I can start in with the transcriptome alone, that having an order of magnitude more data might just allow me to really make some progress. Also there is metadata (just data?) on the sex of the mouse and brain region and stuff like that that may be relevant so I'll try to include. Bottom line is there is still a lot of low hanging fruit before giving up. I have some more ideas to improve the actual machine learning end of things but the right answer is almost always more data (intuition based on my complete lack of experience in the field) so I'm hoping it just isn't a problem.
My computer is churning away calculating mutual information for all the genes and I got to say, I'm highly skeptical of the results. The gene with the highest mutual information with sag time constant during -0.07nA stimulus is Kcnd3. It has literally 0 mutual information when looking at it for -0.11nA stimulus. I think I must find a better way.
Just as a sanity check, I shuffled the output data and ran the same mutual information program again. This is actually good news in the sense that it confirms that there is information contained in the transcriptome data and that I almost certainly didn't make a terrible blunder like an off by one error leading me to mismatch the ephys and transcriptome identities. Clearly this means I still have a lot of work to do before giving up, even before I start adding in more data regarding sex and brain region and whatnot.
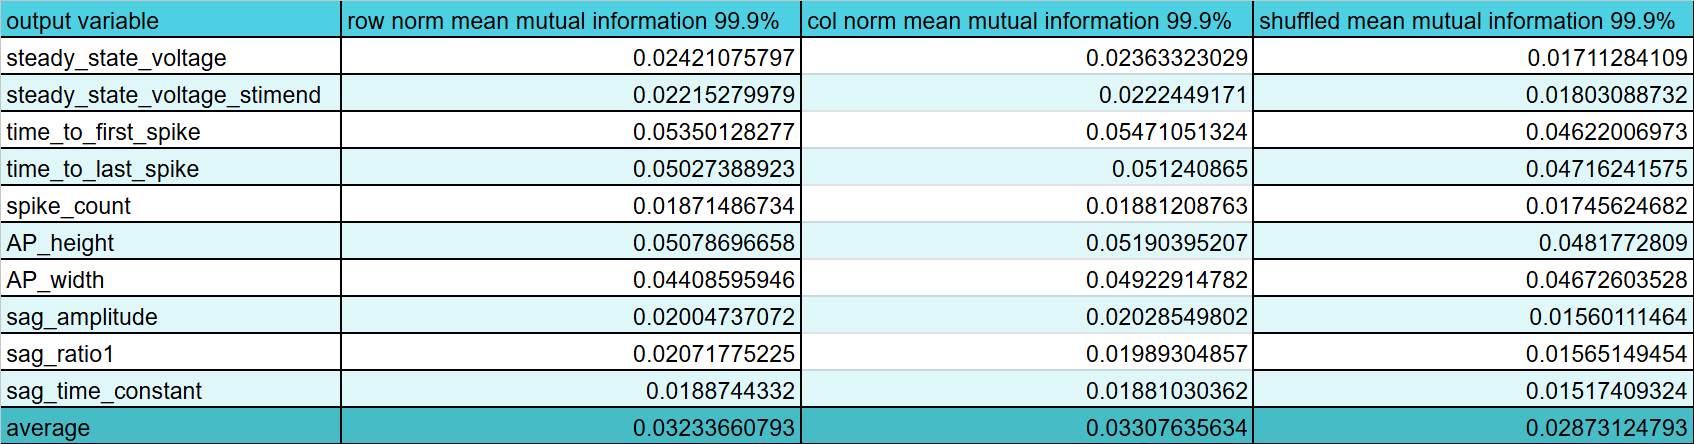
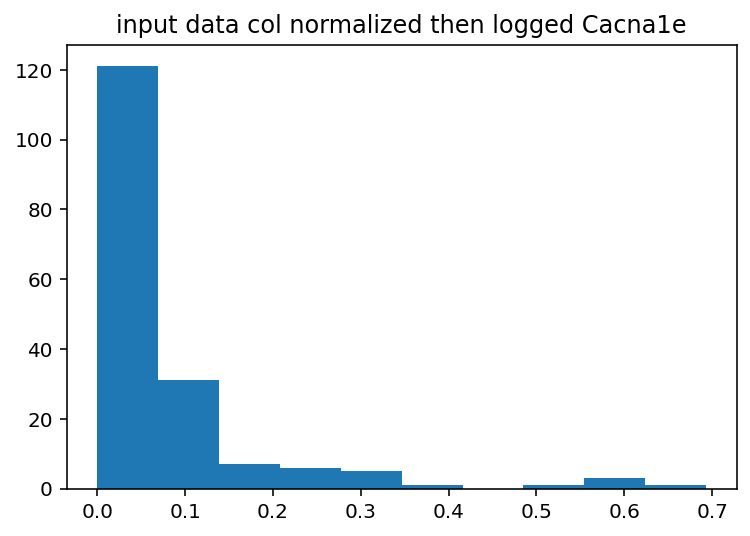
The plot thickens. I've made a big deal about looking at gene expression relative to the cell with the max expression of that gene (what I call column normalization) vs looking at a gene's expression to all the other genes within a given cell (row normalization). Previously, I though it was pretty cut and dry that row normalization was better but here it looks like they convey about the same mutual information and both are still slightly higher than the shuffled data so it is probably not a fluke. As such, I guess I'll have to have both input into the model or something, I'm not sure. Anyway, the current plan is to now try and find out what kind of encoding is best because I've been reading a lot about different methods (binning, log and z-score encoding, and clipping) so I want to look at the distribution of data and see what might be best. Oh the other thing is that I still need to make a neural network that grossly overfits because I think right now my current best with just the transcriptome does really poorly even on train data prediction and I should remedy that before complaining that my test data is bad.
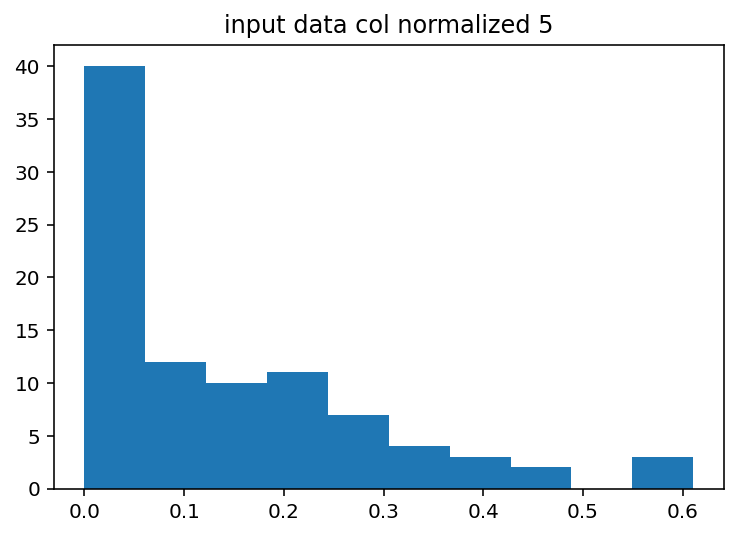
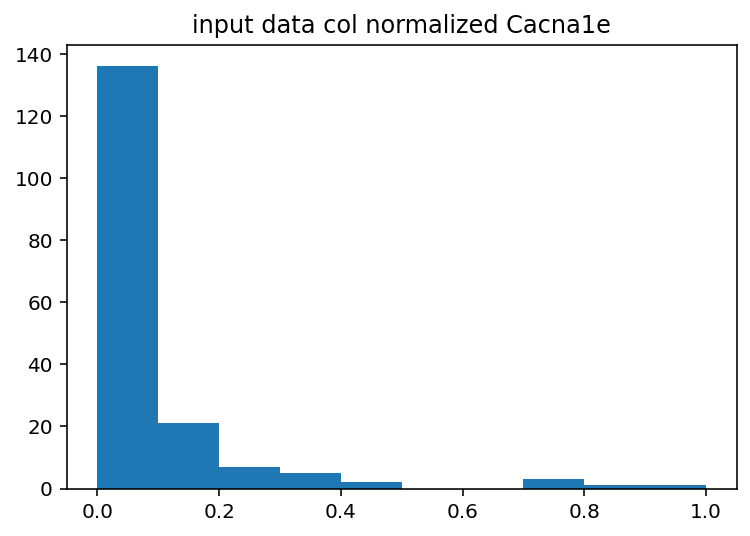
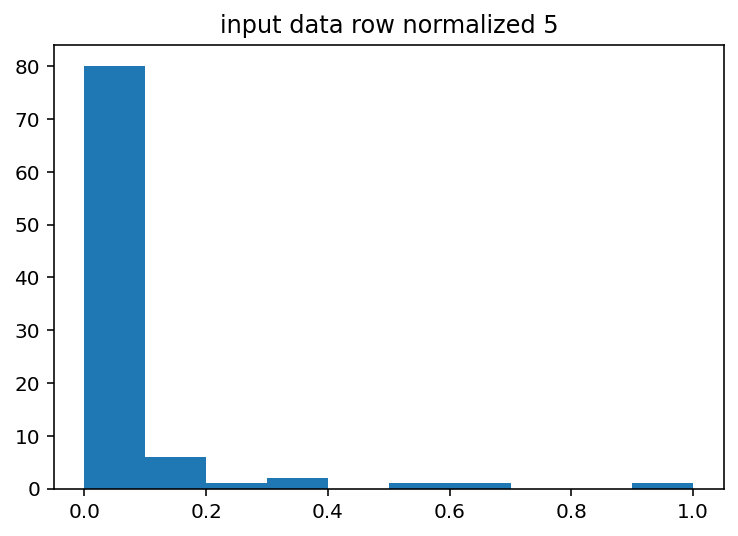
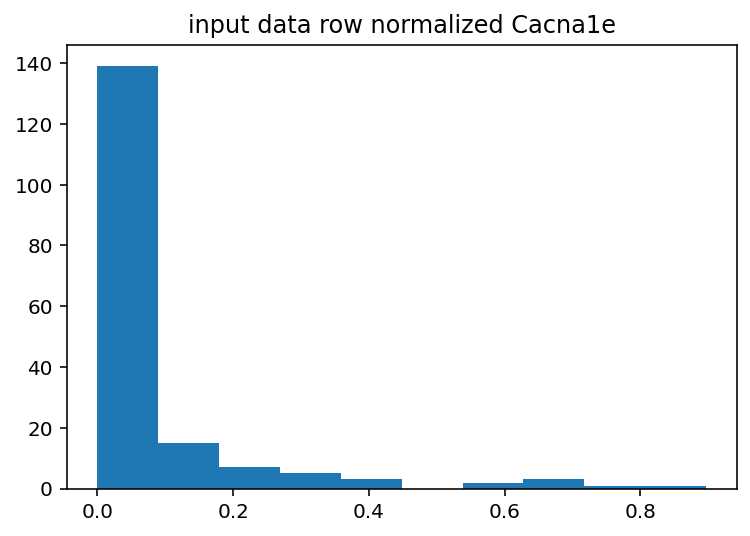
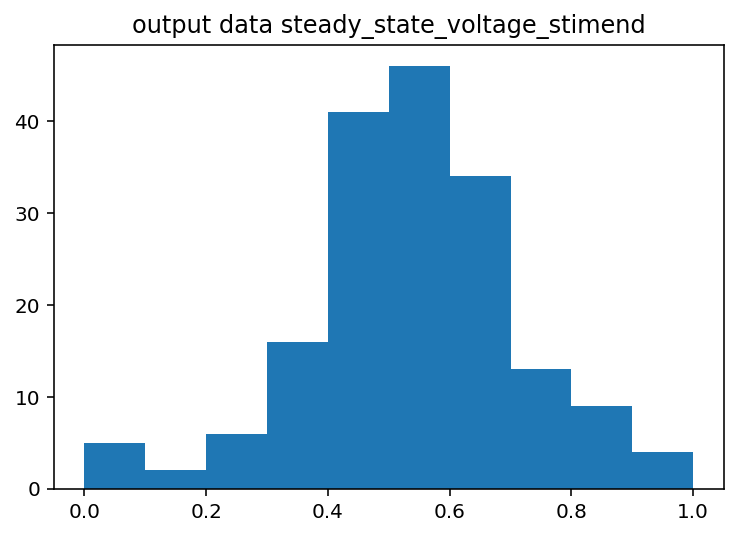
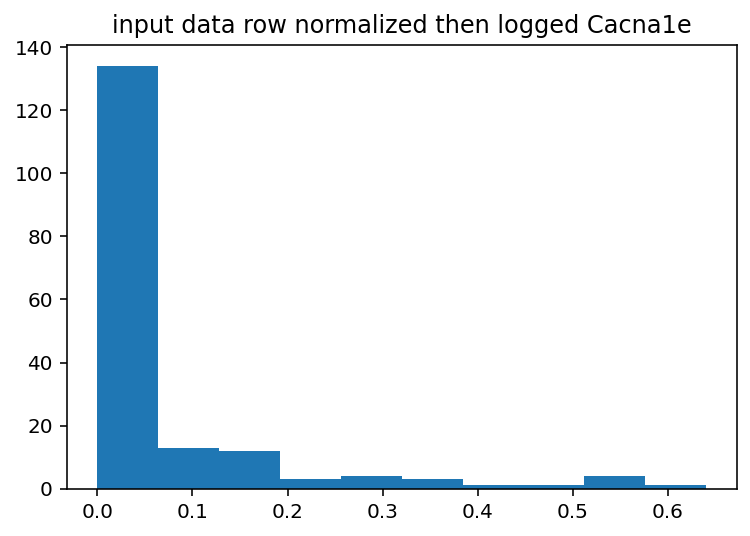
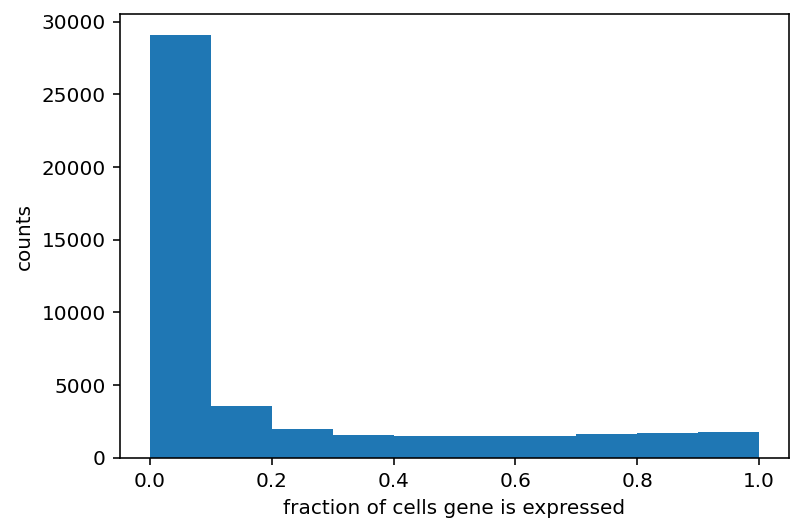
I should have done this ages ago, the input histograms aren't even close to being normal or uniform or anything kind of useful. The output is good so I guess I won't touch that but I should probably log normalize the input data or maybe bin it by quartile. Just to explain what these are a little better, the two graphs with Cacna1e show the distribution of that gene's expression in 200 different cells. The graphs that just say row/column normalization show how all genes compare in a particular cell.
Well, that wasn't overwhelmingly effective. I'm going to try just making the data binary so that anything over 0 becomes 1 and test mutual information to see how that might work. That's the simplest possible binning strategy.
Mutual info with binary variables is quite encouraging, currently doing ridge regression on it. Some of these are as large of an improvement on normalized data as normalized data is on shuffled data so I'm cautiously optimistic, it's definitely a step in the right direction.
Well, that's underwhelming. Maybe feed forward neural networks will be better. So, I have done some work and it turns out there was some bug in my dataloader code for the neural network stuff (chat wrote it, my fault for not checking) but that is fixed now and I can really grossly overfit on the train data so I'm gonna try some hyperparameter tuning and then also playing with exactly how many features I use to see if I can get finally some good results on the test. Code is here.
My power was out for a week and I didn't get to work on this and that made me very sad. However, I did create a very structured list of things I am going to try. The first thing I am really confident I tried correctly is doing PCA on the transcriptome and measuring mutual information. It did terribly, like approximately as bad as the shuffled data. So badly I'm not even going to put in a picture of the results. I'm not exactly sure why this is so bad but I'm going to put PCA way on the backburner because of that.
I have made what is perhaps the smallest possible unit of progress. This model was trained on just the extra metadata (age, sex, hemisphere, brain region, transcriptomics type). There is a very weak (r^2 ~0.087) for both train and test datasets meaning whatever information is being extracted is a genuine connection, not just some overfitting. Now, there's only a few hundred possible combinations so this can't ever be perfectly predictive of a few thousand examples but I will try and get this up a little. Starting with not binarized the age, effectively ignoring it. This was a hold over from the previous code that will be quickly be remedied. Current code is here. That actually may have helped, the test r^2 went up to nearly 0.1. Still not great but if age matters a little I'll take it. Train was worse, trying some early stopping to get the reoughly equivalent again. Ok on further thought I think that age is probably not super relevant but it greatly expands the number of unique combination allowing for overfitting hence the higher test performance but worse train. Not 100% sure that's it but it would make some amount of sense.
I did some work to filter out the brain regions that only had like 40 or fewer occourances, just doesn't seem fair to include them because there is so little data. It's like thousands of examples for VISp2/3 and then 10 each for a bunch of other ones. The r^2 went down but I really don't care. I can always add them back in but tbh I think it's like a statistical fluke. Code is here. I had a new idea for embedding/dimentionality reduction. At work, I do k-means or hierarchical clustering on cells and I think that if I took a random several random subsets of genes and split the cells into, say, 5 categories for each that might effectively encode the information. I'm going to try that and it might give garbage results but it will probably look pretty.
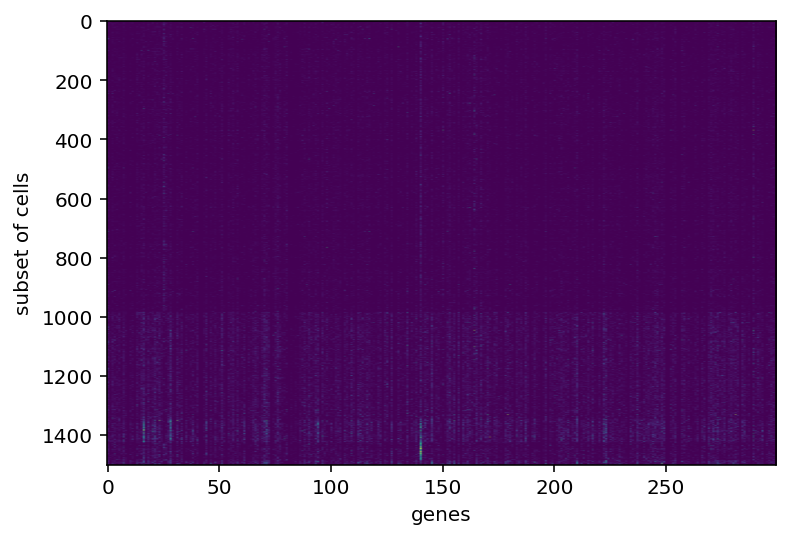
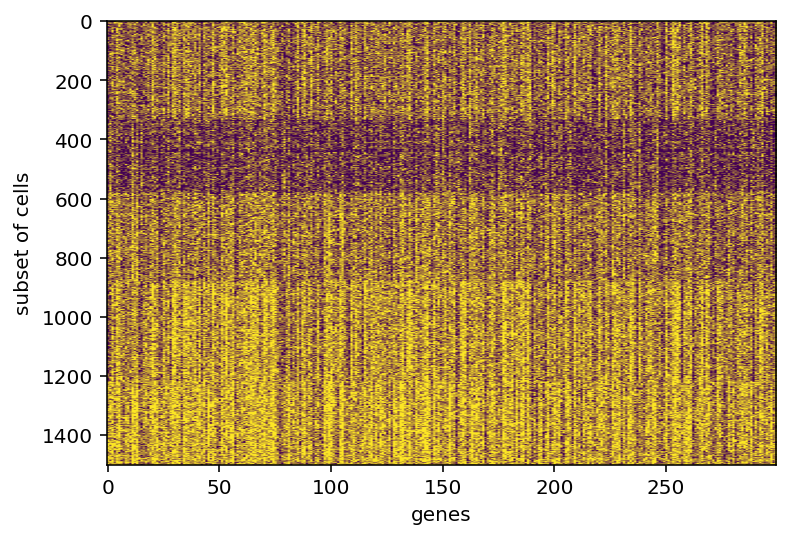
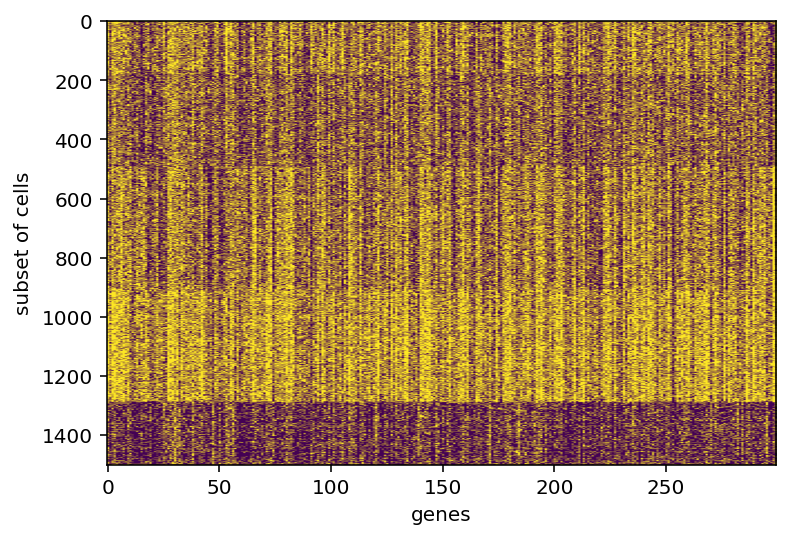
In doing that, I was displaying images of the gene expression (something I should have done years ago) and I noticed that the vast majority of genes seem to predominately always on or always off after binarization. I think I need to dig more into the distribution of this whole gene expression thing before moving on.
Yeah so this shouldn't actually come as a huge surprise. I'm going to restrict my range to only look at genes expressed in 30-70% of all cells. Maybe that is too restrictive but I think it is a good starting point.
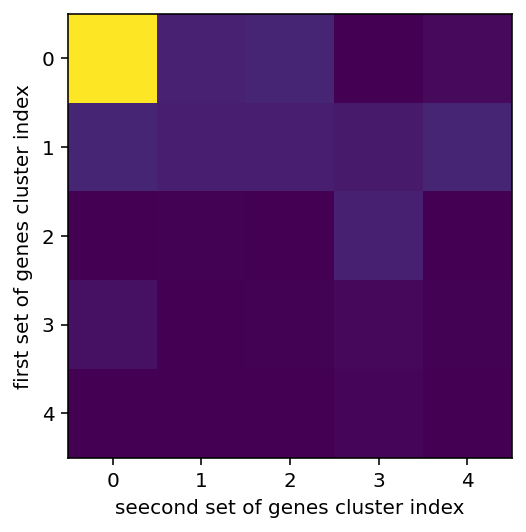
left shows the overlap between various clusters, more yellow of course means higher, middle and right are the gene expression in clusters
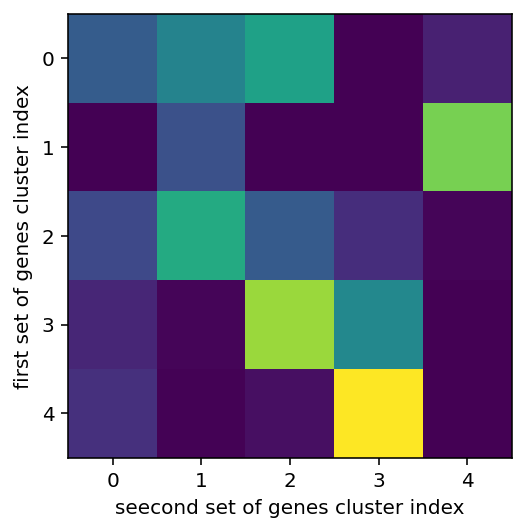
same stuff but gene expression was made binary, I feel the results are superior
So this is not at all self explanatory. We are here looking at a random subset of the genes and cells and using k-means clustering to group them by similarity. Then, we are seeing if the clusters from one random subset of genes highly correlates with the clustering from another subset. We actually don't want it to because then we are just giving the network the same information over and over again. It should encode some real grouping but not look at so many genes it always makes the same groups if that makes sense. I'm going to wrap everything in a function and then use this to do the whole one hot encoding thing. Ok, code is here, let's give a bief update. It seems to work ok ish, at least comparably well to the tests with just metadata so that's cool. I'm going to try and tweak and tune the the hyperparameters including the number of genes per cluster, number of clusters, and number of times I make clusters (boy is that confusing).
Great, I did that and I didn't get great results so I went in and finally checked mutual information and that was devastating.
The most predictive features are (generally) age, transcriptome type, and biological sex which is really frustrating because it might mean we already saturated accuracy because I've used those (unlikely but possible) but also because my clustering and raw gene expression had garbage mutual information meaning more fine grained detail about gene expression is not highly predictive (at least as single variables). So I think the logical thing is to look at every possible pair and triplet of genes and see if that's good. Also going to start with the list of genes responsible for ion channels, that seems like a sensible test case. As a brief aside, I checked mutual information for the morphology again and it was higher than the transcriptome but not as high as the transcriptome type and what not. My intuition is that this is partially due to the sample size being smaller because the MI of the genes was also higher but it is also possible I have an insidious bug somewhere. Anyway, spreadsheet is here, I'm not putting in images anymore, it's unwieldy.
I checked mutual information for every pair of ion channel genes and it was really terrible. I think the next step needs to be digging into this secondary dataset that was in that original paper but in a very confusing place on the Allen Institute. I'm going to be honest, it's probably my fault but I am very confused about how they organize information. Suffice it to say, there is all the data about the cells that were properly reconstructed will full morphology. I will see how predictive the genes are on that and then maybe give up or something. I am burning out a little here.
I'll be honest, I don't know when I worked on this last, I haven't exactly been date stamping this. That doesn't really matter, I have an idea and I'm going to explain what I've been up to and how it led to that idea and get to work. So this demo shows how they used umap to cluster the cells and how those clusters really highly correlate with the transcriptomic type. I thought that, because transcriptomic type had relatively high mutual information, the coordinates in that umap space might be useful. So far, they seem to not be. I did the projection with the highest variance genes as well as the ion channel genes and both made good looking clusters but neither had a correlation from those coordinates to the e-features or ephys properties or whatever I'm calling them. I mean there were some differences in the overall average of clusters but, just look at this:
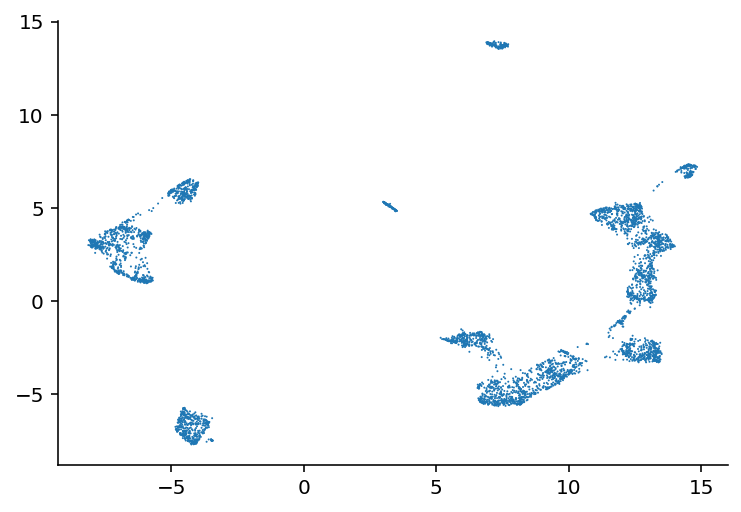
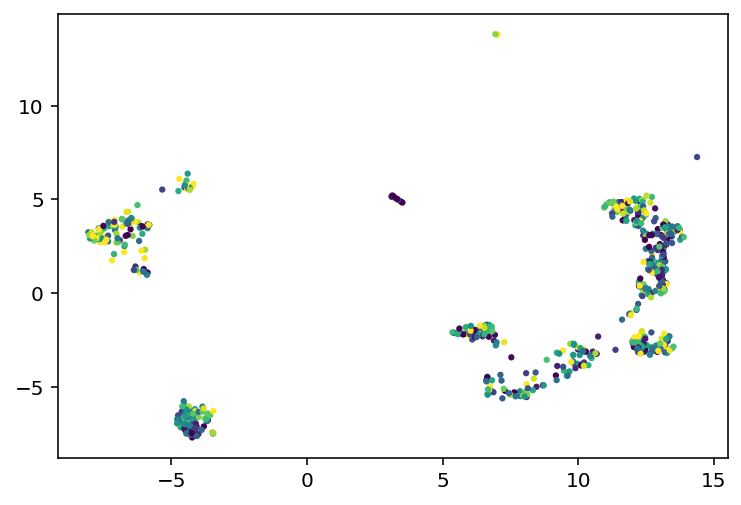
On the left we have every cell plotted and then on the right we have a subset color coded based on the value of that cell's voltage during current stimulation. As you can see, it is mostly a big mess where neighbors have very different colors, especially on the clusters to the far left or right of these plots. So, my plan is to try and find an embedding where neighbors have very similar values to each other. How am I going to do that? Simulated annealing. Pick 500 random genes, use those to do a umap, look at the 5 nearest neighbors for a given cell and see how close they are, and try to minimize that distance. So yeah, current code is here, I'm going to start working on the stimulated annealing.
Unfortunately, that was what I would consider to be an abject failure. Code is here, it may be bugged but yeah, very sad stuff.
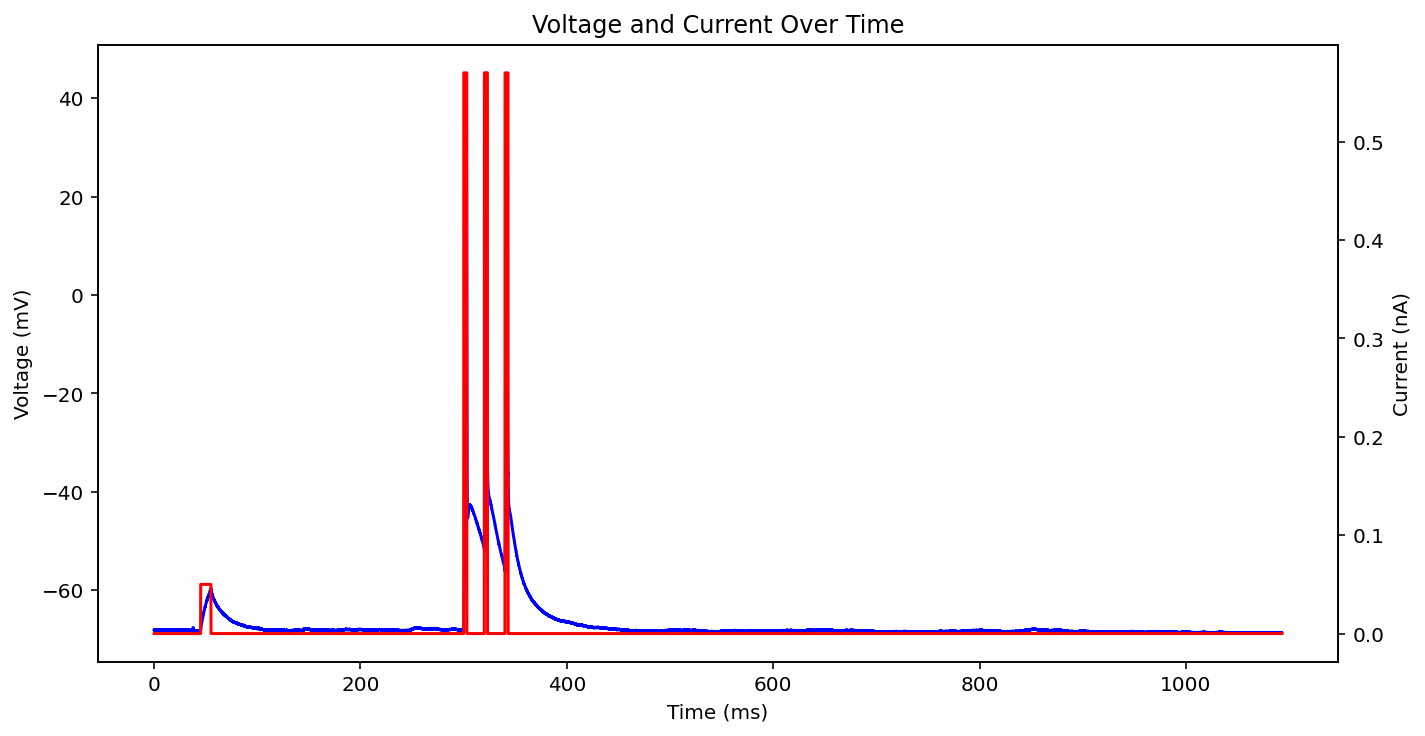
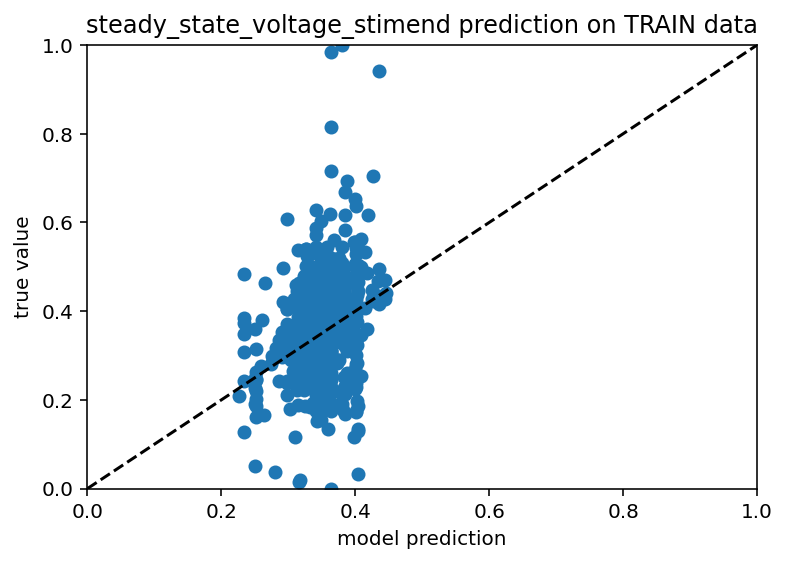
Ok this is going so poorly I had to do a sanity check on something. I have point neuron models with many ion channels and what I did was take the ion channel conductances and use that to predict the stimmed steady state voltage of simulate patch clamp experiments. If this didn't work I don't know where I would have gone. Fortunately, it did work, the r^2 value was like 0.9 which is great, way above the threshold I would be happy with for the real deal. Code here. Now, the next question is whether or not I will be able to predict these efeatures with any accuracy if I don't have access to any morphology. Like I said, these are point neuron models so they don't really have morphology but I can change capacitance and surface area and then just not include that in the input dataset. This also gave me the idea to further restrict the real data to one transcriptomic cell type and to check the mutual information between ion channel conductances and the efeatrues. This synthetic data has many sanity check opportunities. Bolded so I return.
Great so even with some pretty large uncertainty regarding the capacitance and surface area you can still be quite predictive about the efeatures. This actually isn't a huge shock but it does call into question why the real data is so hard to work with. So I have a random normal distribution for those two variables and it looks like there is just a normal distribution around the trend line for predictions. Now, if there are huge effects from the morphology that's fine, I just think it's kind of weird that they'd be so big that they'd dwarf the effect of ion channels I guess. Ok here is code. Below is picture and then after that I'm going to look at mutual information and we'll go from there.
I'm ignoring the mutual information just for a second. Here are some images regarding the umap embedding thing. I am just looking at the resting voltage which is not what I was doing before, this gets around a problem where there were limted samples with a particular current stim, resting voltage is an intrinisc property and I have that for every neuron. I still want to go through the patch clamp experiments again and make sure I have all the square waves saved but that's a lot of work. Anyway, look at this:
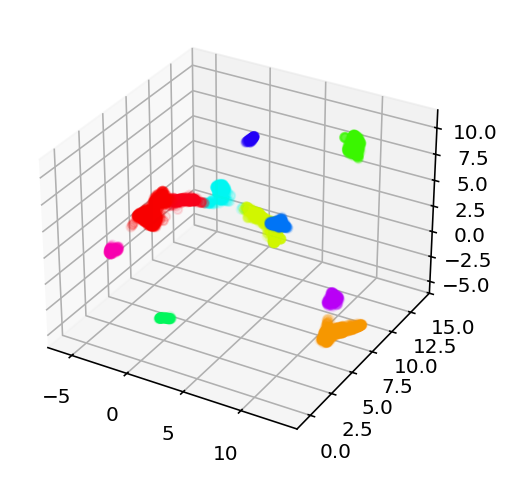
Obviously this is projected into 3D but I am thinking of doing it for 5D or higher for the actual experiments. From left to right we have the projected coordinates colored based on how k-means clustered them together, then we have them colored based on their resting membrane voltage, than we have the first cluster alone also colored on resting voltage. My big concern is that when we zoom into that single cluster, the neighbors still aren't super similar to each other, it's not like a nice gradient or something across the 3 axes. That's why I'm going to try for a 5D embedding, hopefully that will have all the information I need. Well, ain't nothing to it but to do it. Current code is here, I'm going to do ML on those clusters independently. I might also play with how many genes are used or something.
The results were mostly lackluster, one of the cluster had an r squared on 0.17 which is technically a record but the other clusters didn't so it's hollow and it'd doubly hollow because it looks like this:
which is just not good enough for me to declare a success. I am going to try all this again but doing umap on both very high variance genes as well as the ion channel genes. I don't know if that is likely to improve it but it is very easy for a guy like me. Yeah it didn't work. As an aside, the model is doing that thing where it obviosuly trending toward predicting a single column which makes me think there is a problem somewhere. It should at least be able to do crazy overfitting. I'm going to make the embedding dimension 20 and that sould definetly be enough to overfit and if it can't something is wrong. Ok this is really weird. I reran it with 20D umap and 1000 epochs and it didn't collapse to a single point but it also didn't overfit which is suspicious. Also, the r squared for both train and test is ~0.067 which is obviously quite low but it is cool that it is similar between train and test. I just removed dropout and it's still not overfitting, something fishy is going on here and I don't like it one but let me tell you. I have achieved overfitting, I'm going to do a little hyperparameter tuning but it looks a lot like this is going to be a dead end.
Ok I take it back, this is starting to look somewhat promising. Not for every subest of cells and not like a killer r squared value but I just ran it for cluster 6 with an embedding dimension of 10 and I got an r squared of 0.187 on the test data, 0.14 for train.
So yeah, far from perfect but a definite step in the right direction. Here is code and the csv of the embedding and what not. New record! 0.23 r squared. Yeah it actually looks about the same.
Ok this is weird and wacky, I ran the same umap code again but I could not then get good results so this is maybe just a fluke.
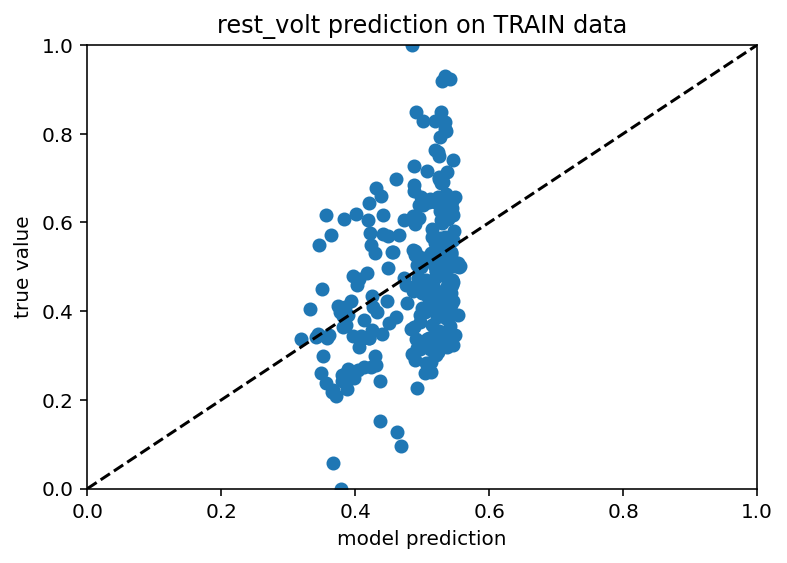
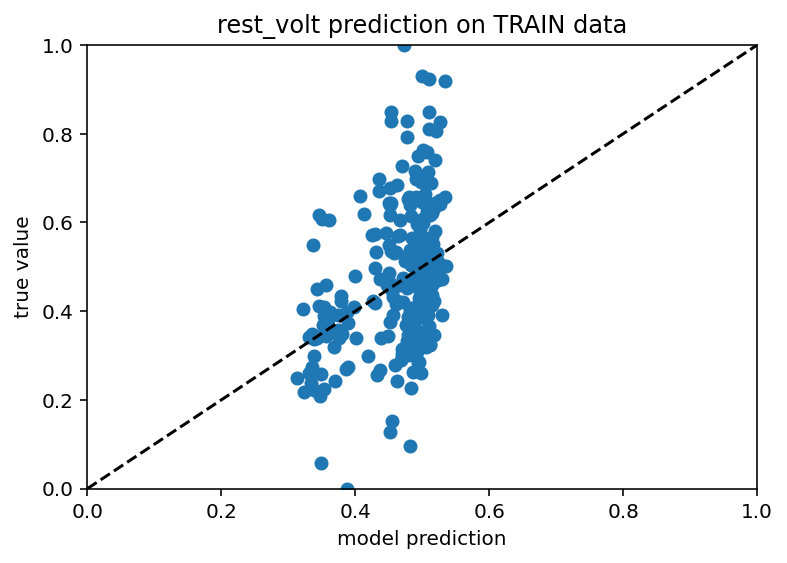
Following up on that fluke thing, I set different random seeds for the train test splitting up of the data and ran it 50 times for different subsets of the data to see what the r squared value is actually likely to be. The results were not what I would consider to be good. The combination of the full UMAP coordinates, the coordinates relative to the center of whatever cluster the cell fell in, and the morphology data yielded a mere 0.034 r sqaured on average. Those first two but no morphology gave 0.057, a modes improvement. Hold on, this is perfect for a spreadsheet.
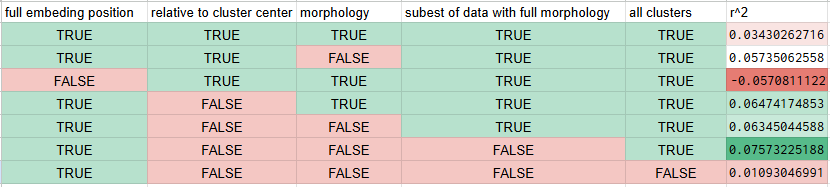
Go absolutely nuts looking at this but the bottom line is that the umap coordinates do encode some information about the resting potential of the neurons, but it is vastly better at predicting the differences between clusters/classes/cell types as opposed to differences within a given cell type which is really quite a shame. Furthermore, morphology does not seem to be all that helpful in predicting anything which is counter to my expectations especially in light of the mutual information thing I did.
Today is June 16th 2025 and I am stopping work on this for a good long while. I still think this is possible but at this point that is more intuition and hope than a reasoned position. The most recent thing I did is as follows. I looked at the efeatures for two different current stimulation levels, -0.03nA and 0.12nA, this way I could get sag ratio and time constant stuff as well as good spiking information. This essentially gave 11 dimensional data for each neuron (not all had these current levels but enough did I am confident about the rest of this) that I then used umap to embed in a 3 dimensional space. I compared this to the embedding of the 500 most variant genes + ion channel genes. If anything was to have good prediction of electrophysiology results, that ought to be it. However, it really did not. I used k-means clustering to cluster the cells into 3 types for the transcriptomic data and then again 3 separate type for the electrophysiology data. These clusters essentially did not line up or correlate in any meaningful way. As such, I am taking a long break from this. I still want to come back as there is work to be done on predicting the ion channel conductances direction but 1) I can't find the transcriptome for those cells and 2) I just want to work on something fun and exciting instead of beating my head into this. Here is the code and here are the graphs showing the lack of success in this comparative clustering thing. This is me loudly giving up.
From left to right, the transcriptome projection of the data with colors corresponding to their clusters, the ephys projection with colors based on ephys clusters, and finally the ephys projection but colored based on the transcriptome clustering
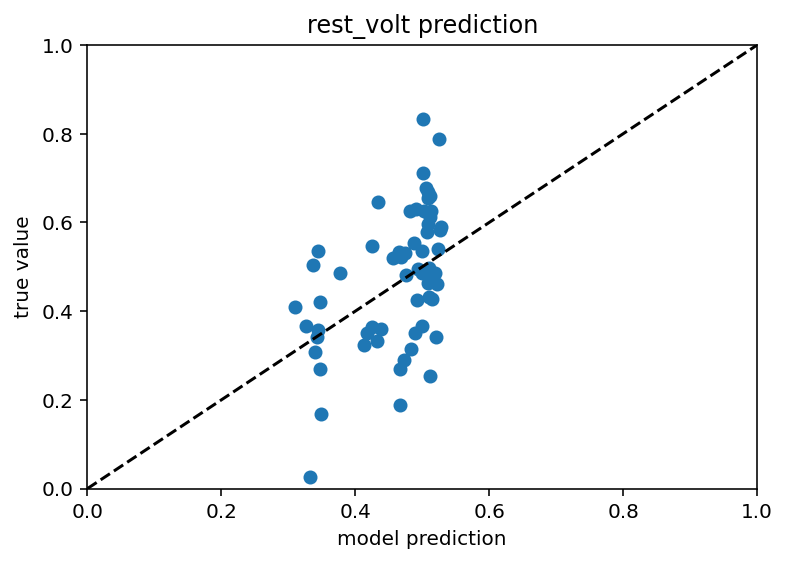
I revived this project a little and I wrote some stuff but it got deleted on accident and it's too 1AM right now for me to write it all, this might stay but hopefully I'll come back and make it nice. The tl;dr is that I kind of have clustering make some sense with transctiptomic type and nearest neighbor regression performs decently well compared to previous attempts, r squared of 0.12 which isn't great but is something.
I'm going to write this up neater at some point, including that last part I really should get to but anyway I had an idea that I think will actually see me through the end of this project. There are two relevant papers: this one where they created models tuned to particular neurons, and this one where they had gene expression profiles and electrophysiology, each done for the same cells. In that second paper, they make the point that predicting efeatures from a particular gene expression profile is really hard because RNA-seq is noisy (should have really listened/remembered/read more closely on that one). BUT, you can do a pretty good job predicting the median efeatures of a group of cells by their median gene expression (they did it, I did it worse and will present results when I'm not lazy). So, in principle it is possible to go from gene expression to efeatures and throwing in morphology might help but I don't think they did that. But that doesn't actually get it quite what I want, I want the ion channel densities so you can make an accurate model of the neuron. Well, that other paper gave me and idea, what if I took the efeatures and morphology, that they measured, and predict the ion channel density, which they provide? Then I would be able to chain those functions together to (in principle) go from gene expression + morphology to efeatures + morphology to ion channel density + morphology. Using just their data it actually isn't super promising just using linear regression but the good news is I can make tons of synthetic data by randomizing the ion channel densities and taking a few hundred different morphologies (available from both papers) and measuring efeatures of a simulated neuron in the hit program NEURON. Then I should be able to get this all to work even if I have to do some stupid complicated machine learning model, I'll just throw endless synthetic data at it and use the stuff from that first paper as test data.
Before I went to do the full send using synthetic data from NEURON (presumably great program, seems like it might cause some confusion if not capitalized), I wanted to use my neuron model to generate some synthetic data because I had success predicting efeatures from ion channel conductances earlier in this very post. The results are interesting to say the least. If you feed the model a ton of efeature data and all the ion channels except one, it actually seems to do a decent job... for about half the data. The other half is just predicting the mean. Here are the scatter plots:
As you can see, there's a weird vertical bar where the model is predicting the mean value for both the train and test data. I don't know if this is a weird bug with my machine learning or some genuine problem trying to generalize from a fairly sparse sampling of all possible neurons but yeah, it's weird. Next steps are:
- See how well this style of model (all ion channels but one) can be used to predict all ion channels if we have one model per ion channel and chain them together starting from some random seed. If that makes no sense, don't worry I will explain later
- Throw some more data at it, currently it is predicting only based on behavior at 2 different current stimulus levels so we could get a lot more efeature data
- See if it can predict all ion channels simultaneously and ignore that whole weird chaining idea
- Try with the NEURON model properly with more realistic morphologies
Code here :)
Good news! I immediately tried predicting using only the efeatures and not the ion channels and got equivalent results so I don't need to do any stupid chaining probably. Next step is obviously to use more efeatures to get the accuracy up. Then after that I'll do the NEURON model.
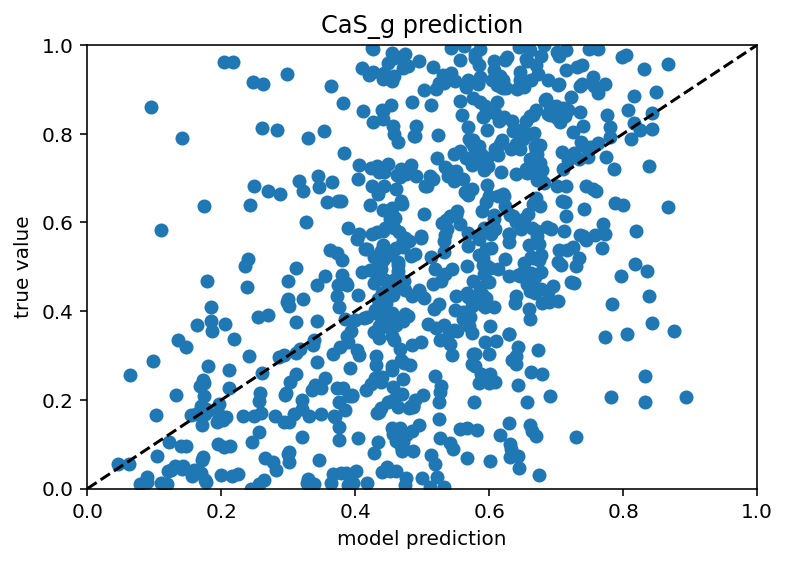
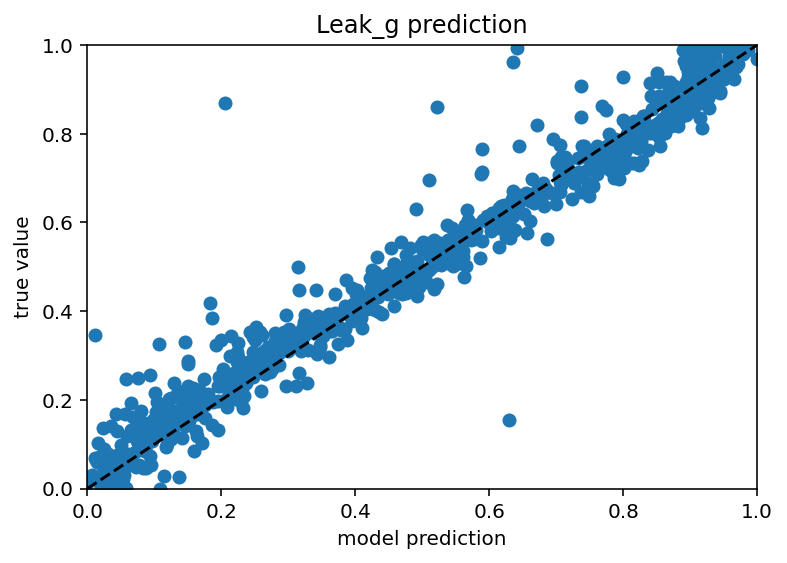
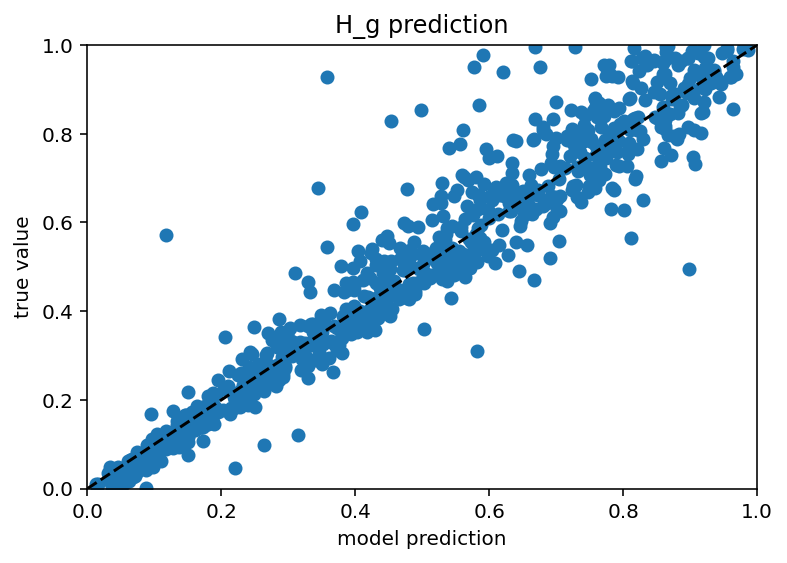
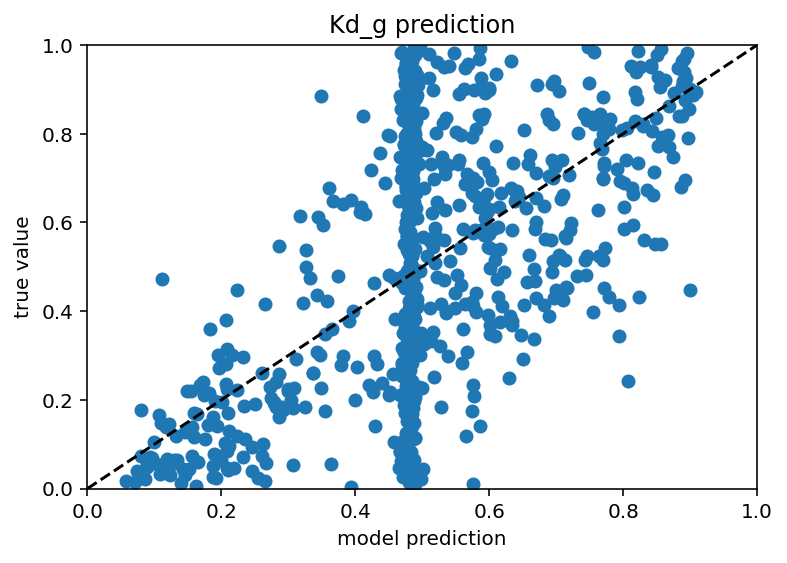
Ok I tested this same thing with just many more current stimulus levels and it did not increase performance really and it still has those weird vertical bars. In someways, this is actually encouraging as it means I don't have to do nearly as many ephys experiments/simulation to predict the ion channels but it would be nice if the plots weren't downright goofy. New code here. Also it seems that different ion channels are learned differenly, Na is kind of easy as is Kd, leak and H are very easy and Ca related are quite hard. Graphs below. I don't have a big takeway from this other than I hope my uncertaintly/error/whatever is withen the HoF uncertainty/error/whatever as there were a range of conductances that gave equivalent results for a given neuron.
Alright, the AllenSDK is not great imo. I am extremely open to this being an uniformed, biased, and downright wrong opinion but I could not easily find documentation on how to run their own neuron models even on the two githubs that had/generated those neuron models. Again, I'm probably an idiot but the whole AllenSDK/NEURON pipeline is horribly confusing to me and leads to a ton of Incompatibilities. What lead to slightly fewer (more solvable?) issues and had good (some) documentation I could understand was Arbor. They have a tutorial dedicated to exactly what i want (yay!) but it only runs on linux (boo) meaning I had to make some weird virtual environment that was a huge pain in the ass. But now I have it and their code didn't work right away and their documentation is literally conflicting, or at least different syntax in different places but none of that matter because I am at least nominally reading in SWC morphology files and JSON 'genomes' for the ion channel conductances and getting a simulate ephys experiment out. My code here. I need to make sure this is actually working because right now it's not showing spikes but I did pick a random morphology and a different random genome so it's tough to say what should happen. Sidenote, for some reason the Arbor function for reading in Allen genomes has different names for the ion channels than Allen does which means it throws an error unless you rename them which is just really great work guys. I don't understand how these simulated ephys experiments aren't more unified in something that is actually easy to use and cross compatible and what not. This comes to mind. Other sidenote, I got 10K pyramidal mouse neuron morphologies from this site and it is a little slow but otherwise absolutely phenomenal compared to so many other things I've had to use personally and professionally I literally checked to see if they had a place I could donate and am now considering sending them a thank you email because of how nice it is to just click a button and download data and it's there and it works instead of some nonsense.
I definitely wasted some time today but I have got the different morphologies loading, 10k realistically randomized json genomes that hold the conductances and other cell properties and confirmed that the simulation actually loads all that in right and can save the traces. Code is here. Tomorrow is for getting everything to run in a loop/parallel so that I get a huge library of cell properties and ephys paired.
I'll be honest, I wrote very little of this, it was either template code or chatGPT but I now have a program that loads in an SWC file and a JSON genome with all the other cellular properties and saves a trace of voltage over time. The code is here and is relatively fast with a few holdouts that take forever. It did the first 7k in like 8 hours but didn't finish the last 3k in the next 16 hours so IDK what is causing that but I don't really care. I do have ~10k files now. Some of them don't exhibit spiking behavior so that's the next step is to find out how many are usable.
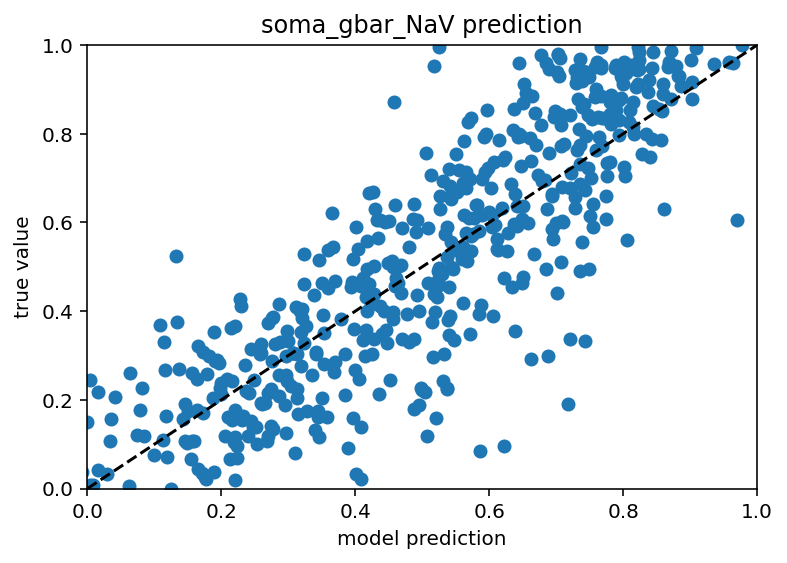
Good news everyone! I have the minimum viable product of what I hope to be the end of the software side of this project. What does that mean exactly? Basically, If I have all but one ion channel conductance and a ton of ephys data for a cell (no switching up the morphologies yet) I can predict that last remaining ion channel. My sincere hope is that I can chain together these models to predict all of the ion channels by iterating over a random initial seed of conductances and replacing the values as each (initially crappy) prediction comes in until it settles with stable values for all. If that works this will already be a huge success. After that though, I would like to generalize it to work with different morphologies. When predicting a given ion channel with only the ephys data or only the other ion channels, the model performs quite poorly, extremely low r^2 values, some times even negative if the model overfits even slightly. With ephys data and the other ion channels, a model was made to predict soma_gbar_NaV with an r^2 of ~0.7 which I think is great for me. Code is here. Graph is below.
Interestingly, the predictions still suck for the axon/dendrite conductances. Whether that is unique to this particular cell or they have little affect for all is something I could investigate but I think just predicting on the soma properties is good enough for now. The true test is, and will always be, how well the ephys features are recreated so I can do some more synthetic data tests to see how much the conductances off the soma matter. Whenever only soma information is available the plot looks like this:
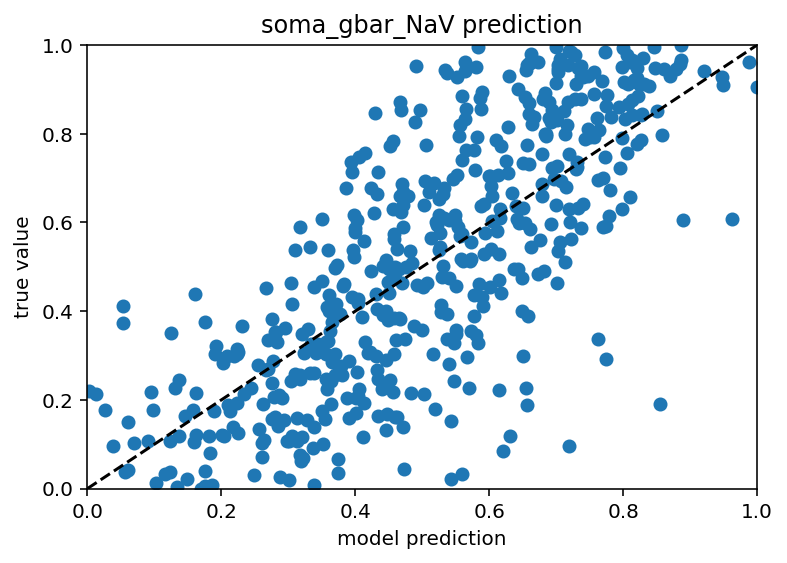
which has an r^2 of ~0.5, so not idea but still pretty good actually. I can try and tie in more of the passives. Really, I should see what properties are predictable and include them and exclude the others regardless of their location. But that is a later optimization. For now, I should try the actual boot strapping as I plan on calling it because it sounds cool and possible descriptive.
Bad news nobody, the boot strapping idea did not work right off the bat which really stinks because it is so theoretically appealing. It did strictly worse at predicting than the models trained just on the ephys data. Now, maybe it is possible that just setting the conductances with high r^2 values to their predicted values gets you essentially identical ephys performance for a simulated cell but I can't test that right now. Code is here.
There are several conductances/cellular properties that are predicted fairly will (r^2 > 0.5) when trained on just ephys data. When other conductances/cellular properties are trained on ephys data + these aforementioned features, their r^2 increases dramatically. The current plan is to have a model that predicts one set of properties from just ephys data then another model that uses these predictions and the ephys data to predict other properties. Why would this work and a more complex model not just implicitly do this? Tough to say but the boot strapping seems so tempting I can't not try. But right now I need to sleep.
Ok so that whole bootstrapping thing is actually called iterative imputation or something. It doesn't matter, it didn't work. What also didn't work was something I thought was really clever. I thought that because the ML models were actually pretty great at predicting some aspects of the ephys (steady_state_voltage, AP_height, sag_ratio1, etc.) from the conductances that maybe I could do some simulated annealing or evolution or something to recover those aforementioned cellular properties by seeing how close a candidate's predicted ephys values are to the right answers for a given cell. It did not work. I can generate cellular properties with predicted ephys properties closer to the measured ephys properties than when the true cellular properties are predicted with the same models. The only issue is that these candidate cellular properties are completely different from what is known to be true. Somewhere there is a disconnect in the accuracy OR there are many properties that give roughly equivalent ephys properties even if they are quite far away in parameter space.
Now, everything here is normalized. My plan is to denormalize everything, test the actual ephys and see what's what. Code is here for the generation of that graph. I also tried a thing to see if the right value for a given property would minimize the MSE on average if all the other properties were randomized and this was tested a bunch of times. It didn't work. It did make this graph which is essentially just a straight line:
Ok, I'm ~80% sure there is a bug in all this causing the cell properties to be misaligned which might explain this horrid performance and I am 100% sure I should check that so I will.
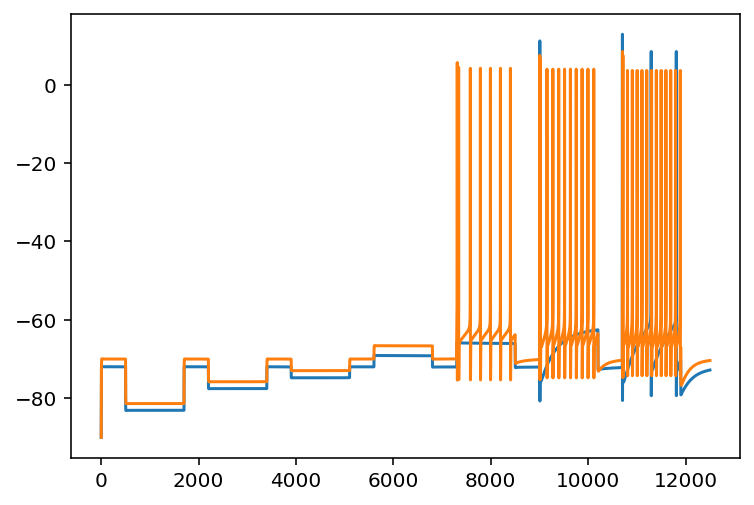
Some would say progress has been made. Actually things are somewhat encouraging for the first time but I'm just in a horrible mood for personal reasons. Well, encouraging might be a strong word, I ironed out some bugs and found something interesting. Basically, using a random search of the cell properties yields good results in terms of recreating passive electrical properties but kind of a crappy job for the spiking behavior. The following (poorly labeled) graph will be instructive.
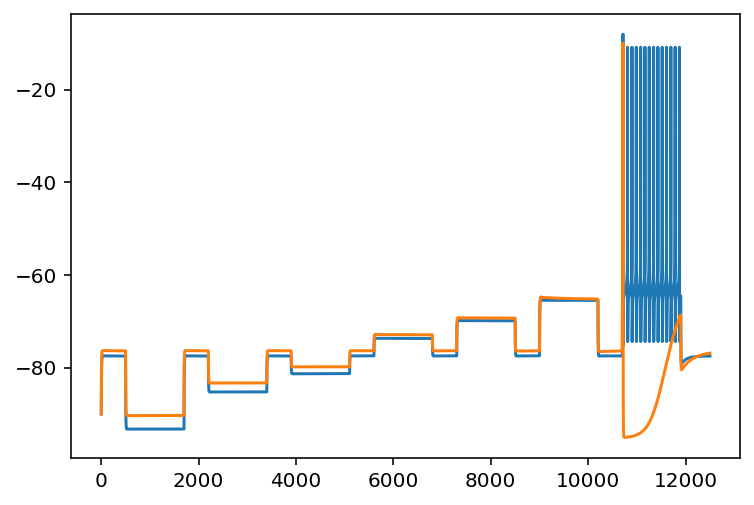
The orange is the voltage of the cell with properties found via random search and evaluated with the ML models. The blue is the ground truth. Clearly, they are pretty close but not perfect. What is a realy issue is the spiking behavior. There are like a dozen spikes missing. Here is another interesting graph.
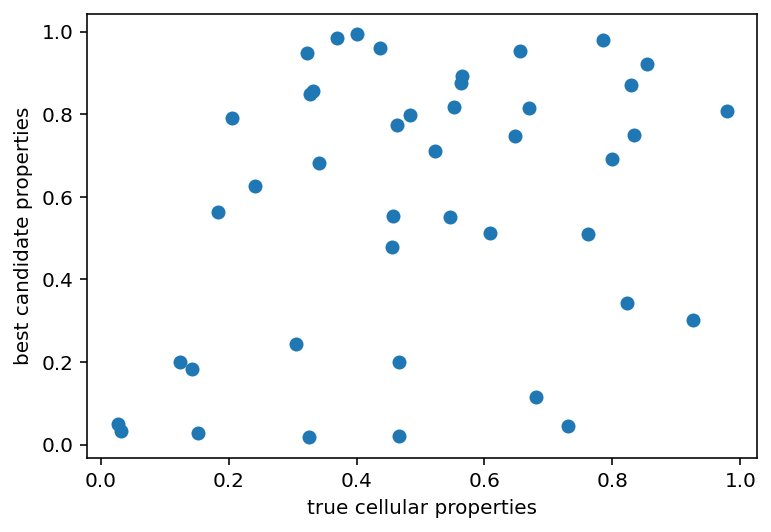
As you can see, there is virtually no correlation between the cell properties that were initially simulated and those that were recoved despite having really similar electrical properties right up until the spikes occur. There are 2 possibilites here:
- With some slight tweaks to this currrent set of ephys properties the same spiking behavior could be achieved, that would mean that cellular properties are not really unique to their corresponding ephys
- We're miles away and need to find some other method of sampling the space to get close/evaluate the model
Just on intuition I feel like 2 is probably true but it really sucks because there are ~40 cellular properties which means that even a pretty sparse sampling is completely impossible to do in its entirety. Now, that can be brought down slightly as there are some properties that could be predicted well from the ephys data alone, those could at least be seed values with the final values only being adjusted slightly. But still, even something super spares like testing 3 points for 20 properties would be ~3.5 billion candidates to evaluate which is not super tenable. I could cheat a little more and do mutual information, I suspect that the soma values matter a lot more than the axon/dendrite properties but I'm not sure. Maybe I could also have some weirdo loop with the bootstrapping where I see how consistent the set of properties is, like the ML models that predict one property using the ephys + all the other cell properties. That might just be super intensive and have the same problem as all the current thing as the issue seems to be almost completely tied up in the spiking activity. The ML models did a particularly poor job predicting the spike count and frequency in particular. It might be worth looking into that and then weighting those extra high in whatever optimization function I use. doesn't get around the fundamental issue of there being a humongous search space. I should also go back and check that thing I was doing right before this, to see if the right value minimizes the error on average. I'm not hopeful about that but it's due diligence. Oh another possibility is that this particular neuron had a really high number of spikes which made it fall toward the edge of the training distribution making things less accurate. I am testing it all again with a different neuron that has only a few spikes.
Cool so I reran the thing on a different cell and it actually spiked more than the original one did.
Yeah that was a sentence that makes sense. Bottom line is I think I'm going to parallelize this and test a tone of them because if I can sometimes have too many spikes and sometimes too few then maybe I'll sometimes get just the right number.
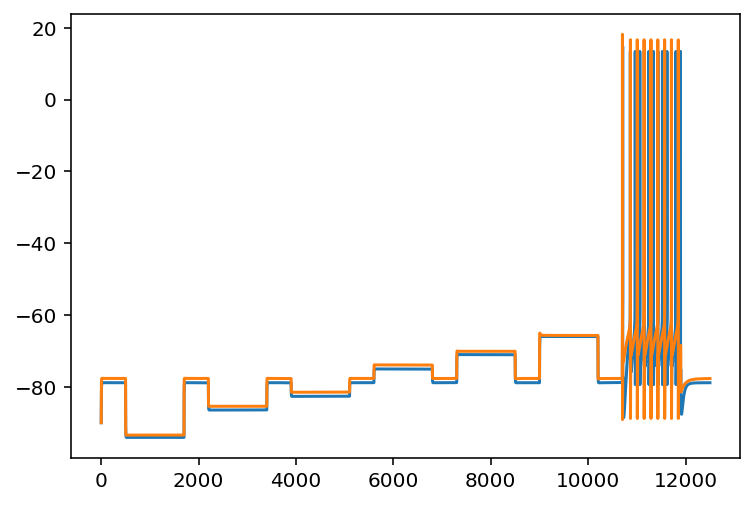
I did some checking into the data I already had and found something very interesting. Pretty much exactly what I expected/feared, there are two simulations with almost identical electrical properties but with pretty different cellular properties. In some ways this can be interpreted as a good thing. Maybe there are a few properties that really matter and the rest have small effects that can be almost ignored or optimized in a fine tuning step. But if that isn't true it kind of calls into question that one paper with their fitting technique. I remember their HoF models had similar properties but since they used an evolutionary algorithm they may have just all had a common ancestor. Would have to go back to check to see how much they searched. Now I need to do mutual information or something, see which of these cellular properties even do anything. Oh the below is the trace of two simulations. I should say, some of their properties are remarkably close, others seem totally dissimilar. This link is to a spreadsheet showing all the ephys features and cell properties. Check out indexes 11 and 13.
As these were both randomly generated in a set of 10k simulations and their fit to each other is comparable to what you would see on Allen Brain map fits that kind of places an upper bound on how many you would have to search with even the most modest filtering using my ML models to predict the resting potential and when the neuron spikes and whatnot. Of course, after I get all this going I need to do a test with real ephys data to make sure I'm not just wasting everyone's time.
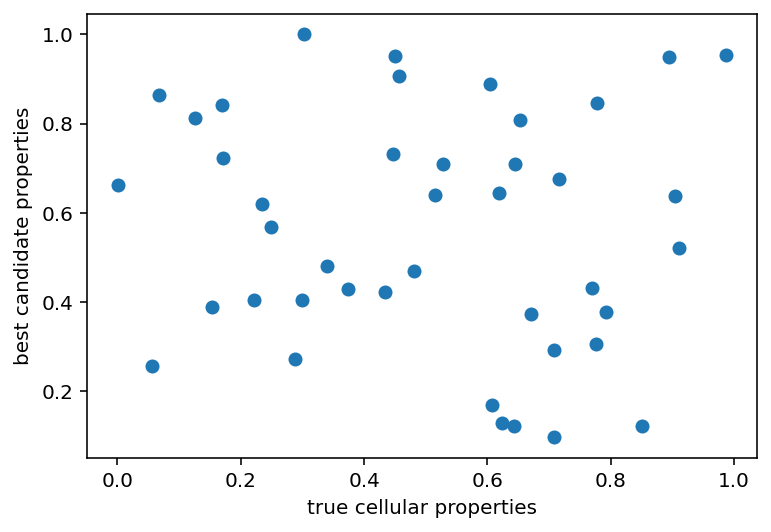
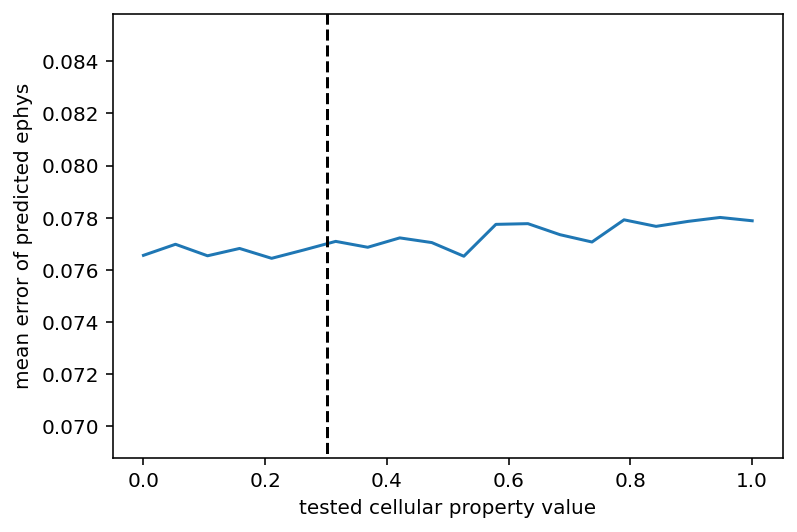
Ok, I did the mutual information thing on the cell properties -> ephys and then (very arbitrarily) selected all the properties that had MI > 0.05 for at least one feature. That list is soma_cm, apic_e_pas, soma_gbar_Kv3_1, apic_g_pas, soma_gamma_CaDynamics, soma_decay_CaDynamics, soma_gbar_Ca_LVA, soma_gbar_NaV, soma_gbar_SK, apic_Ra, and apic_cm if you're interested. I think that this list looks at least somewhat reminiscent of the values that the ML models were good at predicting directly from ephys which does make some sense. As such, I think I'm going to pursue that again, maybe we can predict these and let the stray a little and then the other values just be random then select the best candidate. Oh it has been some time so I'm going to push a bunch of code and hope that I don't forget anything important.
Getting the exact right number of spikes seems really really hard. Furthermore, the only properties that seem to be set more precisely than chance would permit are apic e pas, apic g pas, and soma cm. Even furthermore, if I take the cellular properties and replace those 3 values with the values selected by random search, it does not give the same spiking behavior even though they are generally pretty close. So here is the new plan, try and make the ML models more general to the cell morphology, do the 10K sims with stimulus current the same as they did for some of the Allen Institute cells, generate a bumch of candidates that get somewhat close to a true out of sample neuron and screen with the ML models, then do evolutionary fine tuning with the actual simulation.